Facilitator guide
Case objectives, demonstration plans, debriefs, common mistakes and application checks across all 81 workplace cases and method lessons.
Download Facilitator guide PDF · 166 pages · 65.1 MB OPEXSTUDIO
Observe repeated cycles. Follow the visual, practise a decision, then check your thinking.
Fictional teaching examples and AI-generated illustrations. Proposed changes and goals are not achieved results. Use the written instructions and check local conditions before applying a method.
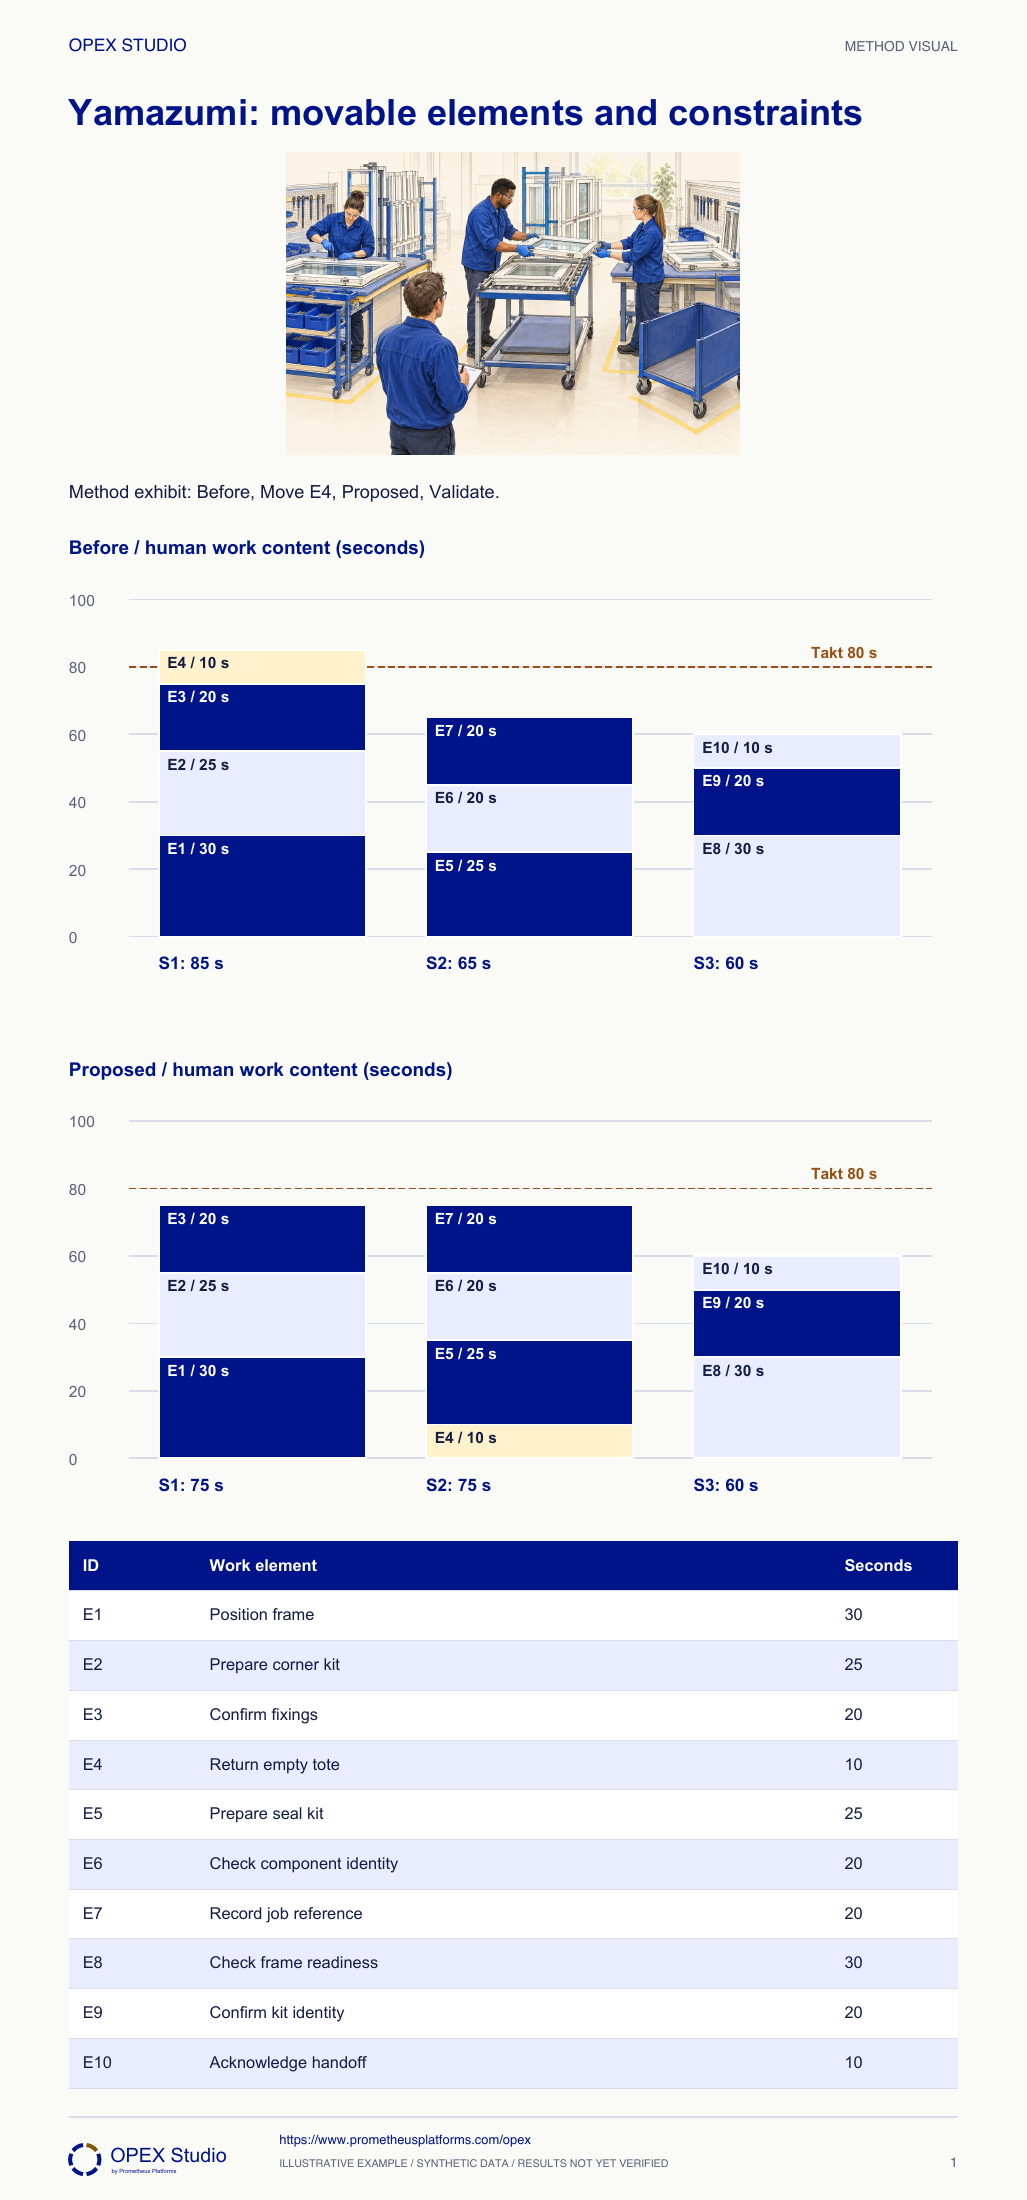
Build each bar from observable work elements so a proposed change remains traceable. Here, operator work content is 85, 65 and 60 seconds against an 80-second takt. Moving E4, the ten-second empty-tote return, from operator one to operator two produces 75, 75 and 60 seconds. Total work remains 210 seconds. This is a theoretical redistribution, not a demonstrated new cycle. Check precedence, walking, skills, ergonomics, variability and machine overlap. The elements and their labels must stay visible in both views. Balanced bars can guide a trial; they do not by themselves justify a staffing decision.
Human work content before: 85/65/60 sec; after proposed E4 transfer: 75/75/60 sec. Takt reference: 80 sec.
E4 Return empty tote is 10 sec and moves only from operator 1 to 2. All ten elements and total 210 sec are preserved.
This is not measured cycle time or a staffing calculation. Validate precedence, walking, skill, ergonomics, variation, machine overlap and quality.
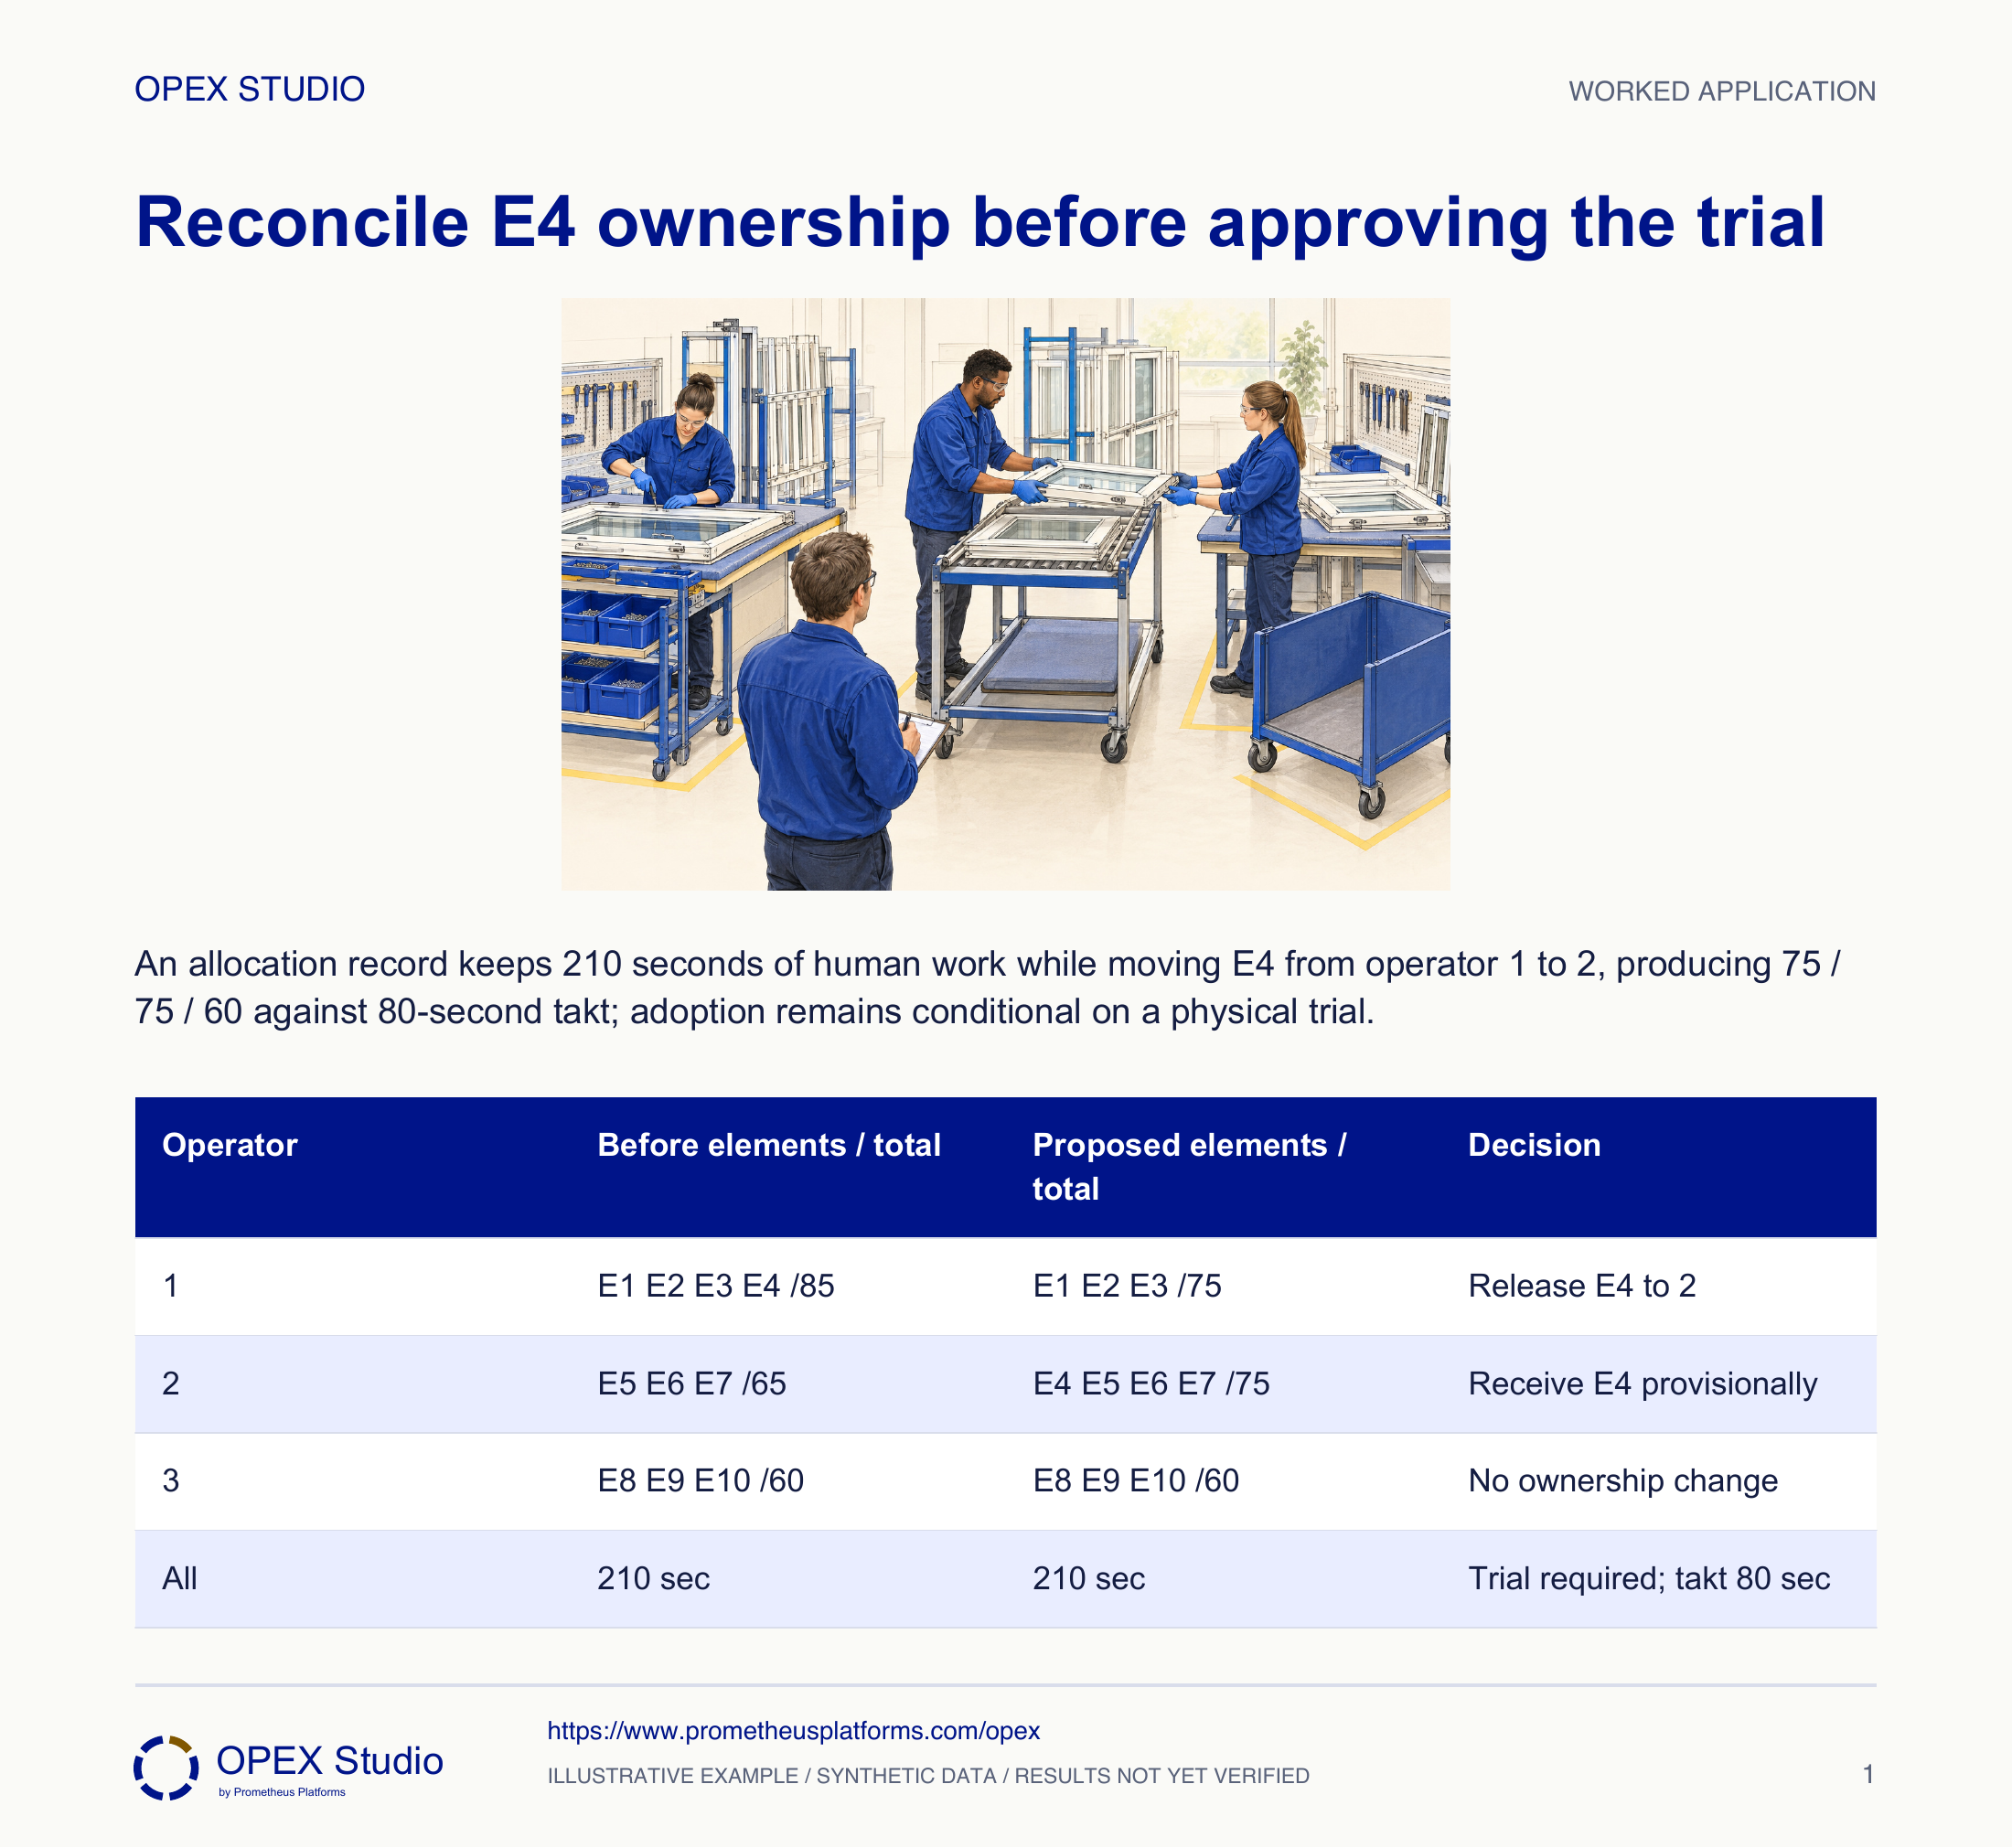
Fictional window-preparation teaching case: three trained operators share ten named elements. The team has 400 net available minutes and demand for 300 units. The supplied element times describe human work content for one unit, not observations proving sustained throughput.
Update operator 2 to 83 seconds and total work to 218 seconds for this trial condition. Do not approve the original transfer unchanged; redesign access or test another authorized method.
83 exceeds 80-second takt by 3 seconds. Averaging the three operators together would conceal the local overload.
Build and interpret work-element stacks, propose a feasible ownership change, and distinguish a balanced work-content chart from verified cycle performance.
Fictional window-preparation teaching case: three trained operators share ten named elements. The team has 400 net available minutes and demand for 300 units. The supplied element times describe human work content for one unit, not observations proving sustained throughput.
Role: Team leader facilitating a trial with the three operators and process engineer.
A proposed sequence must meet demand while retaining quality checks, safe access and the required precedence.
Operator 1 has 85 seconds of assigned work against 80-second takt; operators 2 and 3 have 65 and 60 seconds.
| Reference | Supplied teaching value |
|---|---|
| Net time / demand | 400 min /300 units |
| Takt | 400 ×60 /300 =80 sec/unit |
| Operator 1 | E1:30; E2:25; E3:20; E4:10 sec |
| Operator 2 | E5:25; E6:20; E7:20 sec |
| Operator 3 | E8:30; E9:20; E10:10 sec |
| Transfer candidate | E4 only:10 sec; operator 1 to 2 |
Convert 400 minutes to 24,000 seconds and divide by 300 demanded units. Label the reference line 80 sec/unit and the vertical stacks human work content in seconds.
Why: Using gross shift time or comparing minutes with seconds would create a false gap. Work content and elapsed cycle time answer different questions.
Evidence: 24,000 /300 =80 seconds per required unit.
Stack E1–E4 for operator 1, E5–E7 for operator 2 and E8–E10 for operator 3. Preserve element heights proportional to time and retain the E1–E10 legend.
Why: A total bar shows overload but does not show which real piece of work could move. Removing a quality check just to lower a bar changes the method.
Evidence: 85 +65 +60 =210 seconds of total human work.
Remove only the 10-second E4 segment from operator 1 and add it to operator 2. Keep the other nine elements, their durations and identities unchanged.
Why: Redistribution changes ownership; it does not eliminate work. The total is a useful reconciliation against accidental omission.
Evidence: 75 /75 /60 seconds; total 210. Nominal margins below takt are 5 /5 /20 seconds.
Walk the tote-return route with the operators under the local safe trial procedure. Confirm when the empty tote becomes available and whether operator 2 can reach it without delaying E5–E7 or crossing another task.
Why: The arithmetic assumes E4 is transferable. Precedence and access can invalidate a visually attractive balance.
Evidence: A trial plan names route, handoff point, permitted sequence, observer and stop conditions; actual results remain unfilled.
Record multiple representative cycles and the element causing any wait, including mix, abnormal events and quality outcome. Compare observed performance with the 75 / 75 / 60 prediction before revising the standard.
Why: An average stack below takt does not prove that variability or machine interaction permits every required cycle.
Evidence: Retain timing sheets and a decision to adopt, adapt or stop; do not label the proposed chart an achieved improvement.
| Operator | Before elements / total | Proposed elements / total | Decision |
|---|---|---|---|
| 1 | E1 E2 E3 E4 /85 | E1 E2 E3 /75 | Release E4 to 2 |
| 2 | E5 E6 E7 /65 | E4 E5 E6 E7 /75 | Receive E4 provisionally |
| 3 | E8 E9 E10 /60 | E8 E9 E10 /60 | No ownership change |
| All | 210 sec | 210 sec | Trial required; takt 80 sec |
A hypothetical trial reveals that operator 2 needs 8 additional seconds of walking per unit to perform the tote return. This was absent from the supplied element model.
Update operator 2 to 83 seconds and total work to 218 seconds for this trial condition. Do not approve the original transfer unchanged; redesign access or test another authorized method.
83 exceeds 80-second takt by 3 seconds. Averaging the three operators together would conceal the local overload.
Record the extra walking as a new observed element, its timing basis and operating condition; retain the original proposal for comparison.
Separate fictional planning exercise using the same E1–E10 durations: net time remains 400 minutes but demand rises to 320 units. E4 remains the only provisionally movable element. A trial then observes E4 taking 12 seconds at operator 2 instead of 10, with all other supplied elements unchanged.
| Changed input | Value |
|---|---|
| Net time | 400 min |
| Demand | 320 units |
| Original allocation | 85 /65 /60 sec |
| Paper transfer | E4:10 sec from 1 to 2 |
| Trial E4 at 2 | 12 sec; other elements unchanged |
24,000 /320 =75 seconds per unit. The paper allocation is 75 / 75 / 60, with margins 0 / 0 / 15 seconds; equality to takt leaves no nominal allowance for variation.
Replacing the 10-second E4 with 12 seconds gives 75 / 77 / 60 and total 212 seconds. Operator 2 exceeds the new takt by 2 seconds.
The proposal is not demonstrated capable of meeting the changed demand. Investigate the E4 condition and authorized alternatives, then collect representative cycle and quality evidence. Do not delete checks or demand faster work to make the graph fit.
| Calculation / decision | Worked result |
|---|---|
| New takt | 75 sec/unit |
| Paper proposal | 75 /75 /60; total 210 sec |
| Observed E4 variant | 75 /77 /60; total 212 sec |
| Decision | Adapt and retest; no achieved capacity claim |
What does this vertical axis measure?
Which work disappeared? None: reconcile 210.
Does zero nominal margin prove the new demand is feasible?
What observation could invalidate your neat bars?
Draw stacks on a shared scale, complete the changed-demand problem, then compare reasoning with the answer.
Owner: Team leader and affected operators, supported by process engineering
Record: Element observation sheet, proposed assignment and trial decision
Review: Before changing the standard and after representative trial cycles
Evidence: Element timing/variation, safe access, precedence, quality and actual cycle behavior
Retain the authorized method, address the limiting condition and revise the trial; escalate systemic capacity gaps through daily management.
Proportional work-element stacks versus takt, also called yamazumi
Method reference; original OPEX scenario and diagram are synthetic teaching content, not source case results.Read the lessons online or use these PDFs to prepare, practise and review with your team. No sign-in needed.
Case objectives, demonstration plans, debriefs, common mistakes and application checks across all 81 workplace cases and method lessons.
Download Facilitator guide PDF · 166 pages · 65.1 MBPrintable case worksheets, blank observation records and five calculation exercises; answers are separate.
Download Learner workbook PDF · 169 pages · 10.7 MBReasoned sample responses, worked calculations and coaching guidance; fictional examples are clearly labelled.
Download Answer key and coaching notes PDF · 105 pages · 8.5 MBThe native method mechanisms and worked applications for all 68 detailed lessons, in a separate bookmarked portrait reference.
Download Method and application reference PDF · 141 pages · 10.2 MBFive illustrated system chapters: 15 Flare concept maps and 26 original workplace teaching cards, with links to all 81 supporting cases and method lessons.
Download Illustrated systems atlas PDF · 69 pages · 55.8 MBExplore this connected method and its separate application conditions.
Explore the connected method →Explore this connected method and its separate application conditions.
Explore the connected method →Explore this connected method and its separate application conditions.
Explore the connected method →Explore this connected method and its separate application conditions.
Explore the connected method →