Facilitator guide
Case objectives, demonstration plans, debriefs, common mistakes and application checks across all 81 workplace cases and method lessons.
Download Facilitator guide PDF · 166 pages · 65.1 MB OPEXSTUDIO
Define event and denominator. Follow the visual, practise a decision, then check your thinking.
Fictional teaching examples and AI-generated illustrations. Proposed changes and goals are not achieved results. Use the written instructions and check local conditions before applying a method.
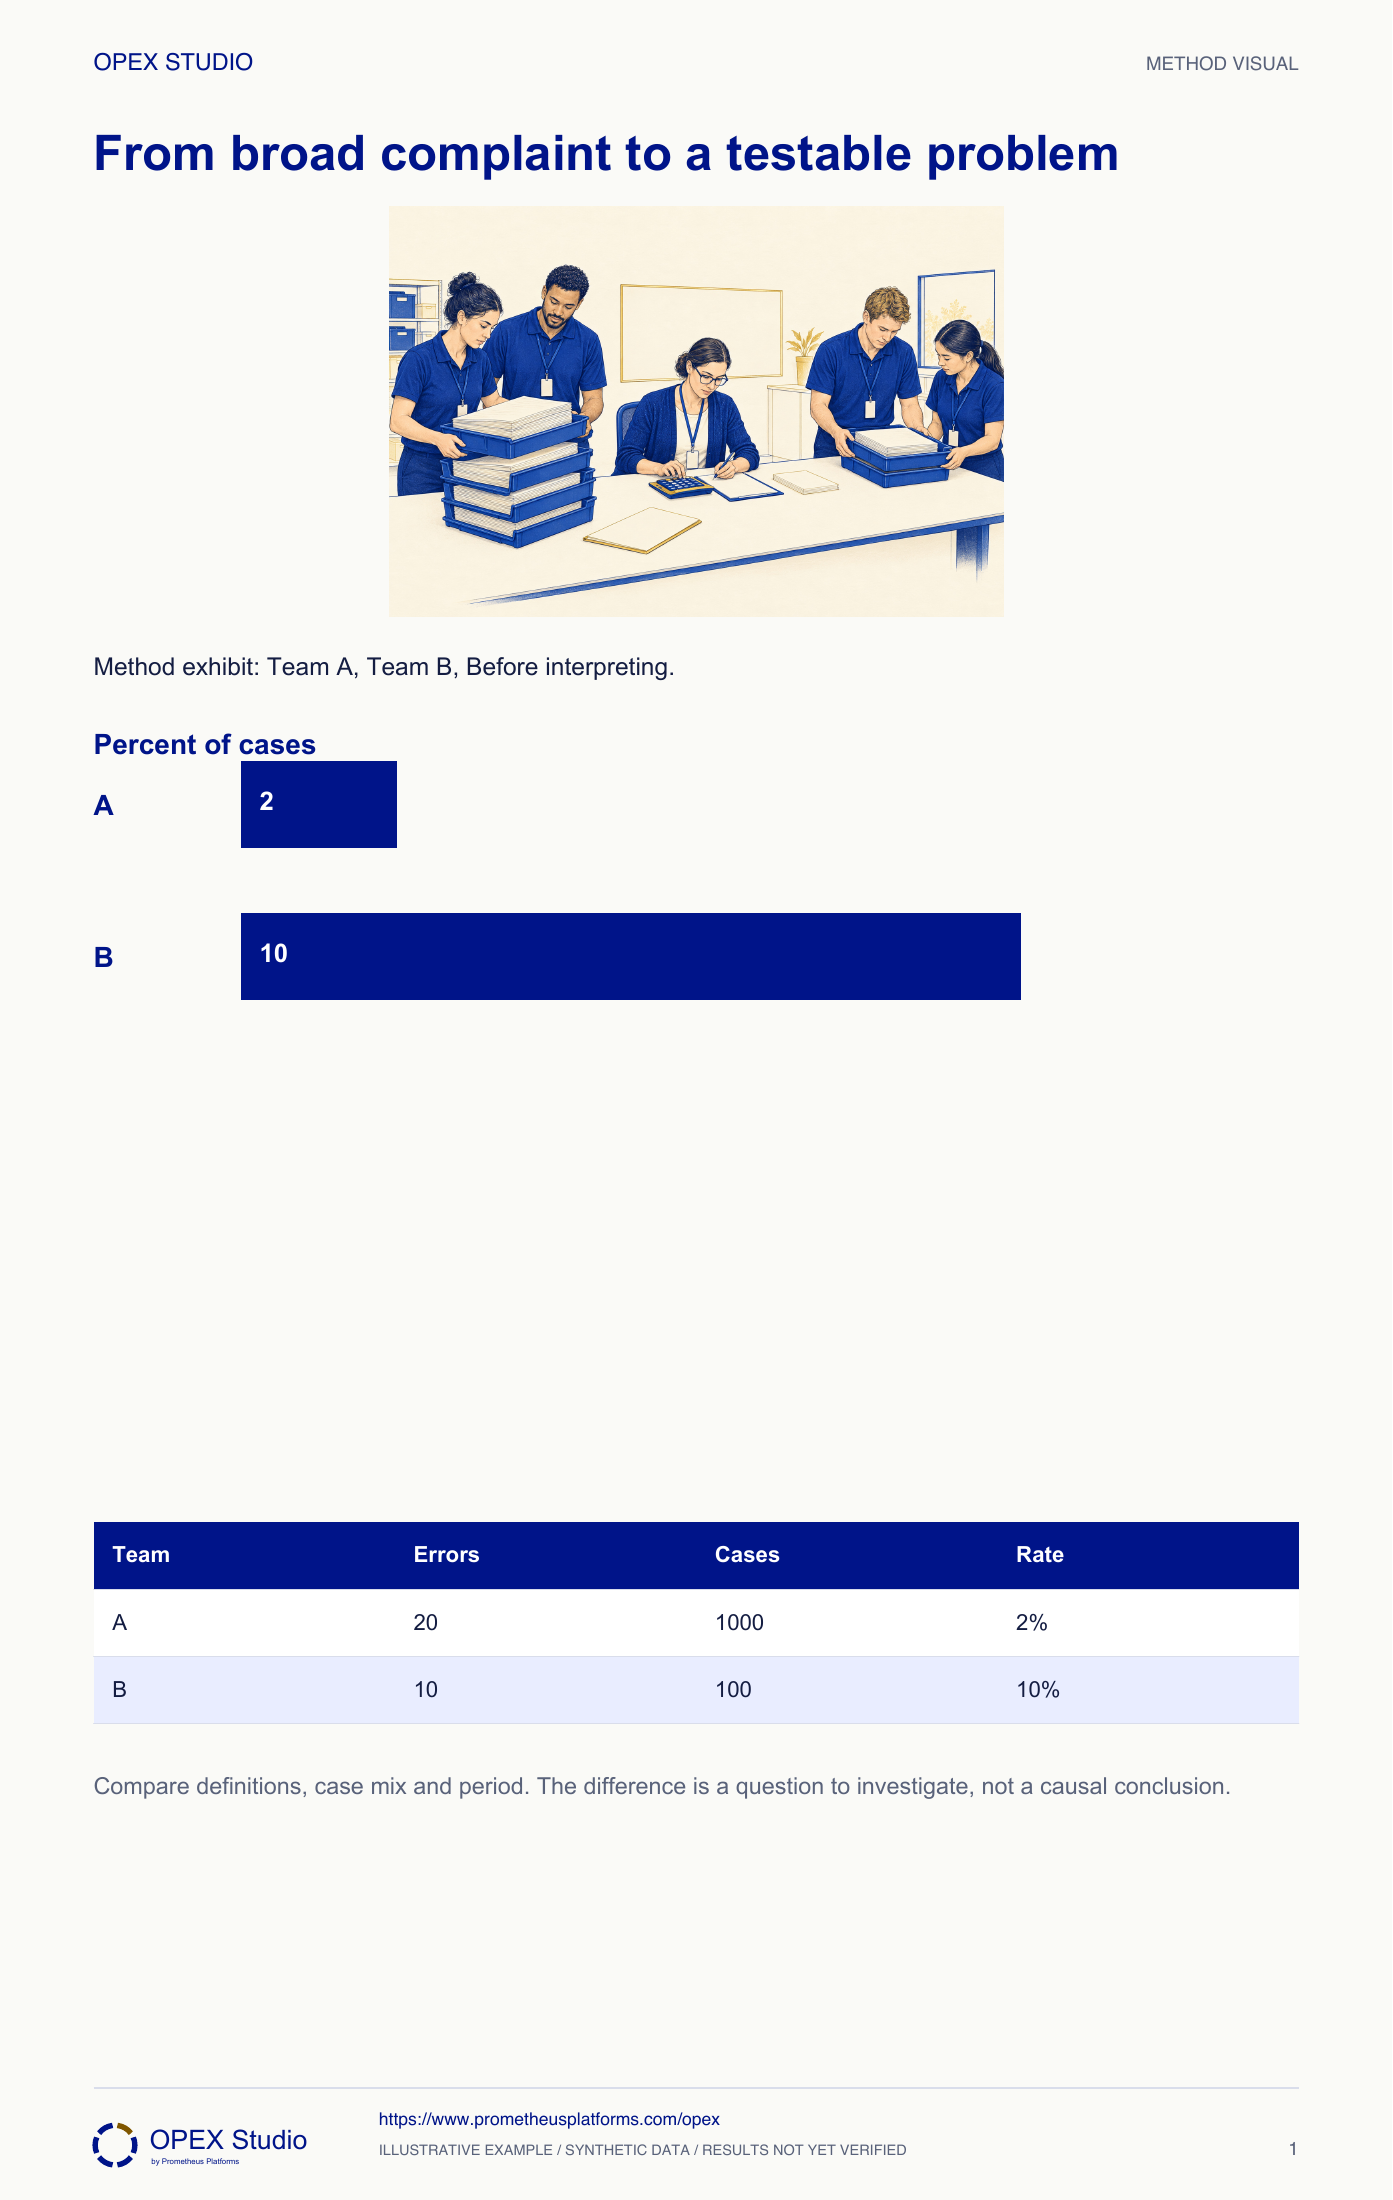
A broad complaint rarely gives a team enough direction to test a cause. Define what counts as the problem, over what period and out of how many opportunities. Break comparable observations down by useful factors such as request class, location or shift. Distinguish large counts from high rates. Then observe where the concentrated gap occurs and choose an analysis method suited to its mechanism. A ranking can guide attention but cannot establish causation. Keep reopened work and exceptions within the declared boundary so that an apparent improvement does not simply move the problem out of the measure.
Largest count need not mean highest rate.
Pareto ranking does not prove cause.
Precedes 5 Whys or experiment; Measurement definitions carry into control.
Fictional request-processing review: team A reports 20 errors in 1,000 cases; team B reports 10 in 100. Manager Elif initially assigns all improvement attention to A because its error count is larger. The shared error definition and case mix still need checking.
Do not rank team capability from the pooled rates. Obtain comparable within-type counts and examine the work conditions.
Case mix can change aggregate rates even when a named team is not the cause.
Convert counts into comparable rates, define a focused problem and choose the next breakdown without treating a difference as proof of cause.
Fictional request-processing review: team A reports 20 errors in 1,000 cases; team B reports 10 in 100. Manager Elif initially assigns all improvement attention to A because its error count is larger. The shared error definition and case mix still need checking.
Role: Process analyst with both team representatives.
Counts and denominators refer to the same period and definition; comparisons state their scope.
Raw counts suggest one priority while rates suggest another.
| Team | Cases with error | Total cases |
|---|---|---|
| A | 20 | 1,000 |
| B | 10 | 100 |
| Period | Same fictional week | Definition pending confirmation |
| Case mix | Routine and exception requests | Breakdown not yet supplied |
Elif confirms that numerator and denominator refer to completed cases in the same week and asks whether both teams apply the same error rule.
Why: Twenty defects and ten defective cases are not comparable numerators.
Evidence: A written definition and period are attached before interpreting.
Calculate A as 20 / 1,000 × 100 = 2% and B as 10 / 100 × 100 = 10%. Keep counts alongside rates.
Why: The denominator exposes different opportunity volume, while the counts show the size of the observed burden.
Evidence: Rate bars use one percent scale and retain both sample sizes.
Request routine/exception case counts and error counts for each team, then examine where and when the specific error occurs. Avoid collecting every available category without a question.
Why: A useful stratum narrows the gap or tests a comparability concern; it does not simply make another chart.
Evidence: The next collection plan names case type, event definition and handoff point.
State that B has 10 error-containing cases among 100 in the supplied week, with case mix and detection comparability unresolved. Assign the next observation before choosing a cause.
Why: A higher observed rate does not establish worse effort or a causal mechanism.
Evidence: Problem statement includes denominator, time, uncertainty and next owner.
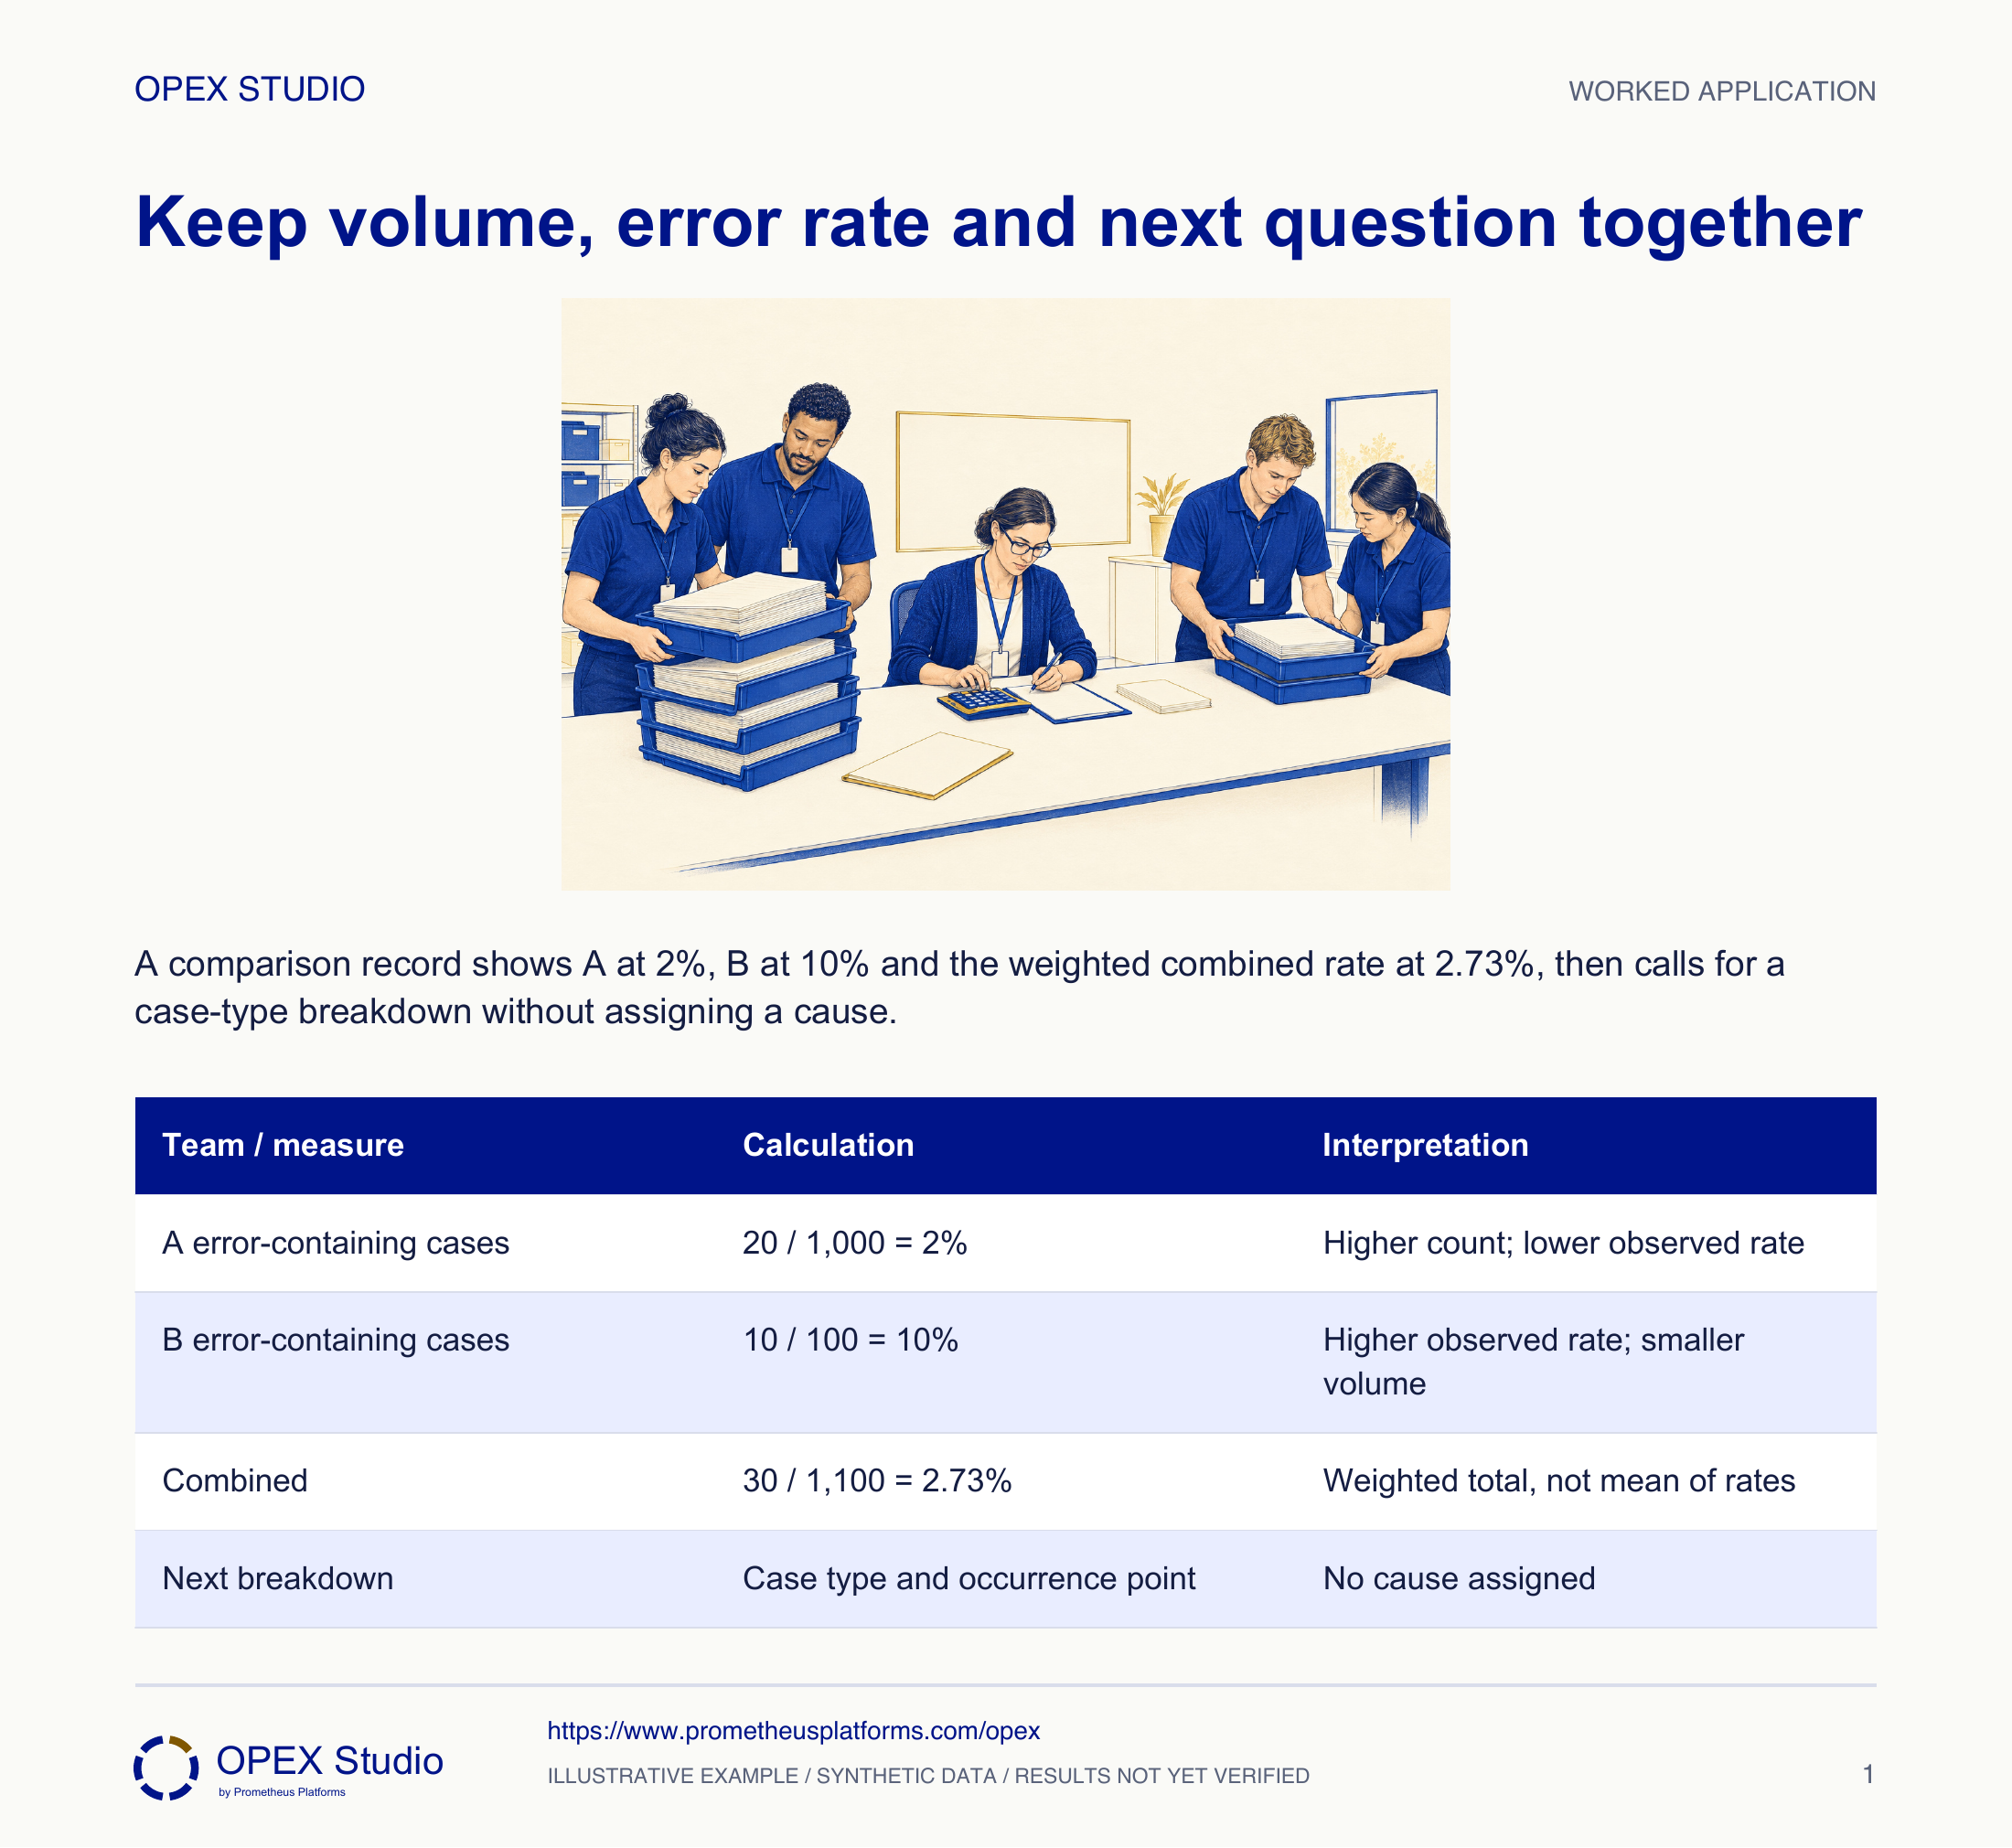
| Team / measure | Calculation | Interpretation |
|---|---|---|
| A error-containing cases | 20 / 1,000 = 2% | Higher count; lower observed rate |
| B error-containing cases | 10 / 100 = 10% | Higher observed rate; smaller volume |
| Combined | 30 / 1,100 = 2.73% | Weighted total, not mean of rates |
| Next breakdown | Case type and occurrence point | No cause assigned |
Further fictional records show B handles mainly exceptions and A mainly routine cases, but type-specific denominators have not yet been reconciled.
Do not rank team capability from the pooled rates. Obtain comparable within-type counts and examine the work conditions.
Case mix can change aggregate rates even when a named team is not the cause.
Retain original totals and reconcile each stratum back to them before interpretation.
New fictional comparison: team C has 12 error-containing cases among 240 and D has 8 among 160 in one week under a shared definition.
| Team | Error cases | All cases |
|---|---|---|
| C | 12 | 240 |
| D | 8 | 160 |
C is 5% and D is 5%; together 20 / 400 = 5%. C has more errors because it also has more cases in this sample.
Equal observed rates do not prove identical processes or future performance. Case mix, detection and variability remain relevant.
A defensible next step might separate request type and occurrence handoff, with errors and all cases counted consistently in each group.
| Measure | Calculation / interpretation |
|---|---|
| C | 12 / 240 = 5% |
| D | 8 / 160 = 5% |
| Combined | 20 / 400 = 5% |
| Conclusion | No worse-rate claim from raw counts |
What changes when volume is revealed?
Why is the combined rate not 6%?
What claim can you support?
Which question will the new category answer?
Calculate the combined rate from summed counts, then write one cautious problem statement.
Owner: Process analyst and representatives who apply the event definition
Record: Stratified counts/rates with data definitions
Review: After collection and before causal analysis or prioritization
Evidence: Reconciled denominators, comparable scope and point-of-occurrence observations
Repair definitions or collect missing denominators rather than rank people from incomplete counts.
Analysis method must fit problem; model must not default blindly to 5 Whys
Method reference; original OPEX scenario and diagram are synthetic teaching content, not source case results.Plan source/category fields before collection and examine relevant groups separately to reveal patterns hidden by aggregation.
Method principle only; OPEX team counts and calculations are original fictional examples. No source diagram or template is reproduced.Read the lessons online or use these PDFs to prepare, practise and review with your team. No sign-in needed.
Case objectives, demonstration plans, debriefs, common mistakes and application checks across all 81 workplace cases and method lessons.
Download Facilitator guide PDF · 166 pages · 65.1 MBPrintable case worksheets, blank observation records and five calculation exercises; answers are separate.
Download Learner workbook PDF · 169 pages · 10.7 MBReasoned sample responses, worked calculations and coaching guidance; fictional examples are clearly labelled.
Download Answer key and coaching notes PDF · 105 pages · 8.5 MBThe native method mechanisms and worked applications for all 68 detailed lessons, in a separate bookmarked portrait reference.
Download Method and application reference PDF · 141 pages · 10.2 MBFive illustrated system chapters: 15 Flare concept maps and 26 original workplace teaching cards, with links to all 81 supporting cases and method lessons.
Download Illustrated systems atlas PDF · 69 pages · 55.8 MBExplore this connected method and its separate application conditions.
Explore the connected method →Explore this connected method and its separate application conditions.
Explore the connected method →Explore this connected method and its separate application conditions.
Explore the connected method →Explore this connected method and its separate application conditions.
Explore the connected method →Explore this connected method and its separate application conditions.
Explore the connected method →