Facilitator guide
Case objectives, demonstration plans, debriefs, common mistakes and application checks across all 81 workplace cases and method lessons.
Download Facilitator guide PDF · 166 pages · 65.1 MB OPEXSTUDIO
Take five comparable readings in each defined subgroup.. Follow the visual, practise a decision, then check your thinking.
Fictional teaching examples and AI-generated illustrations. Proposed changes and goals are not achieved results. Use the written instructions and check local conditions before applying a method.
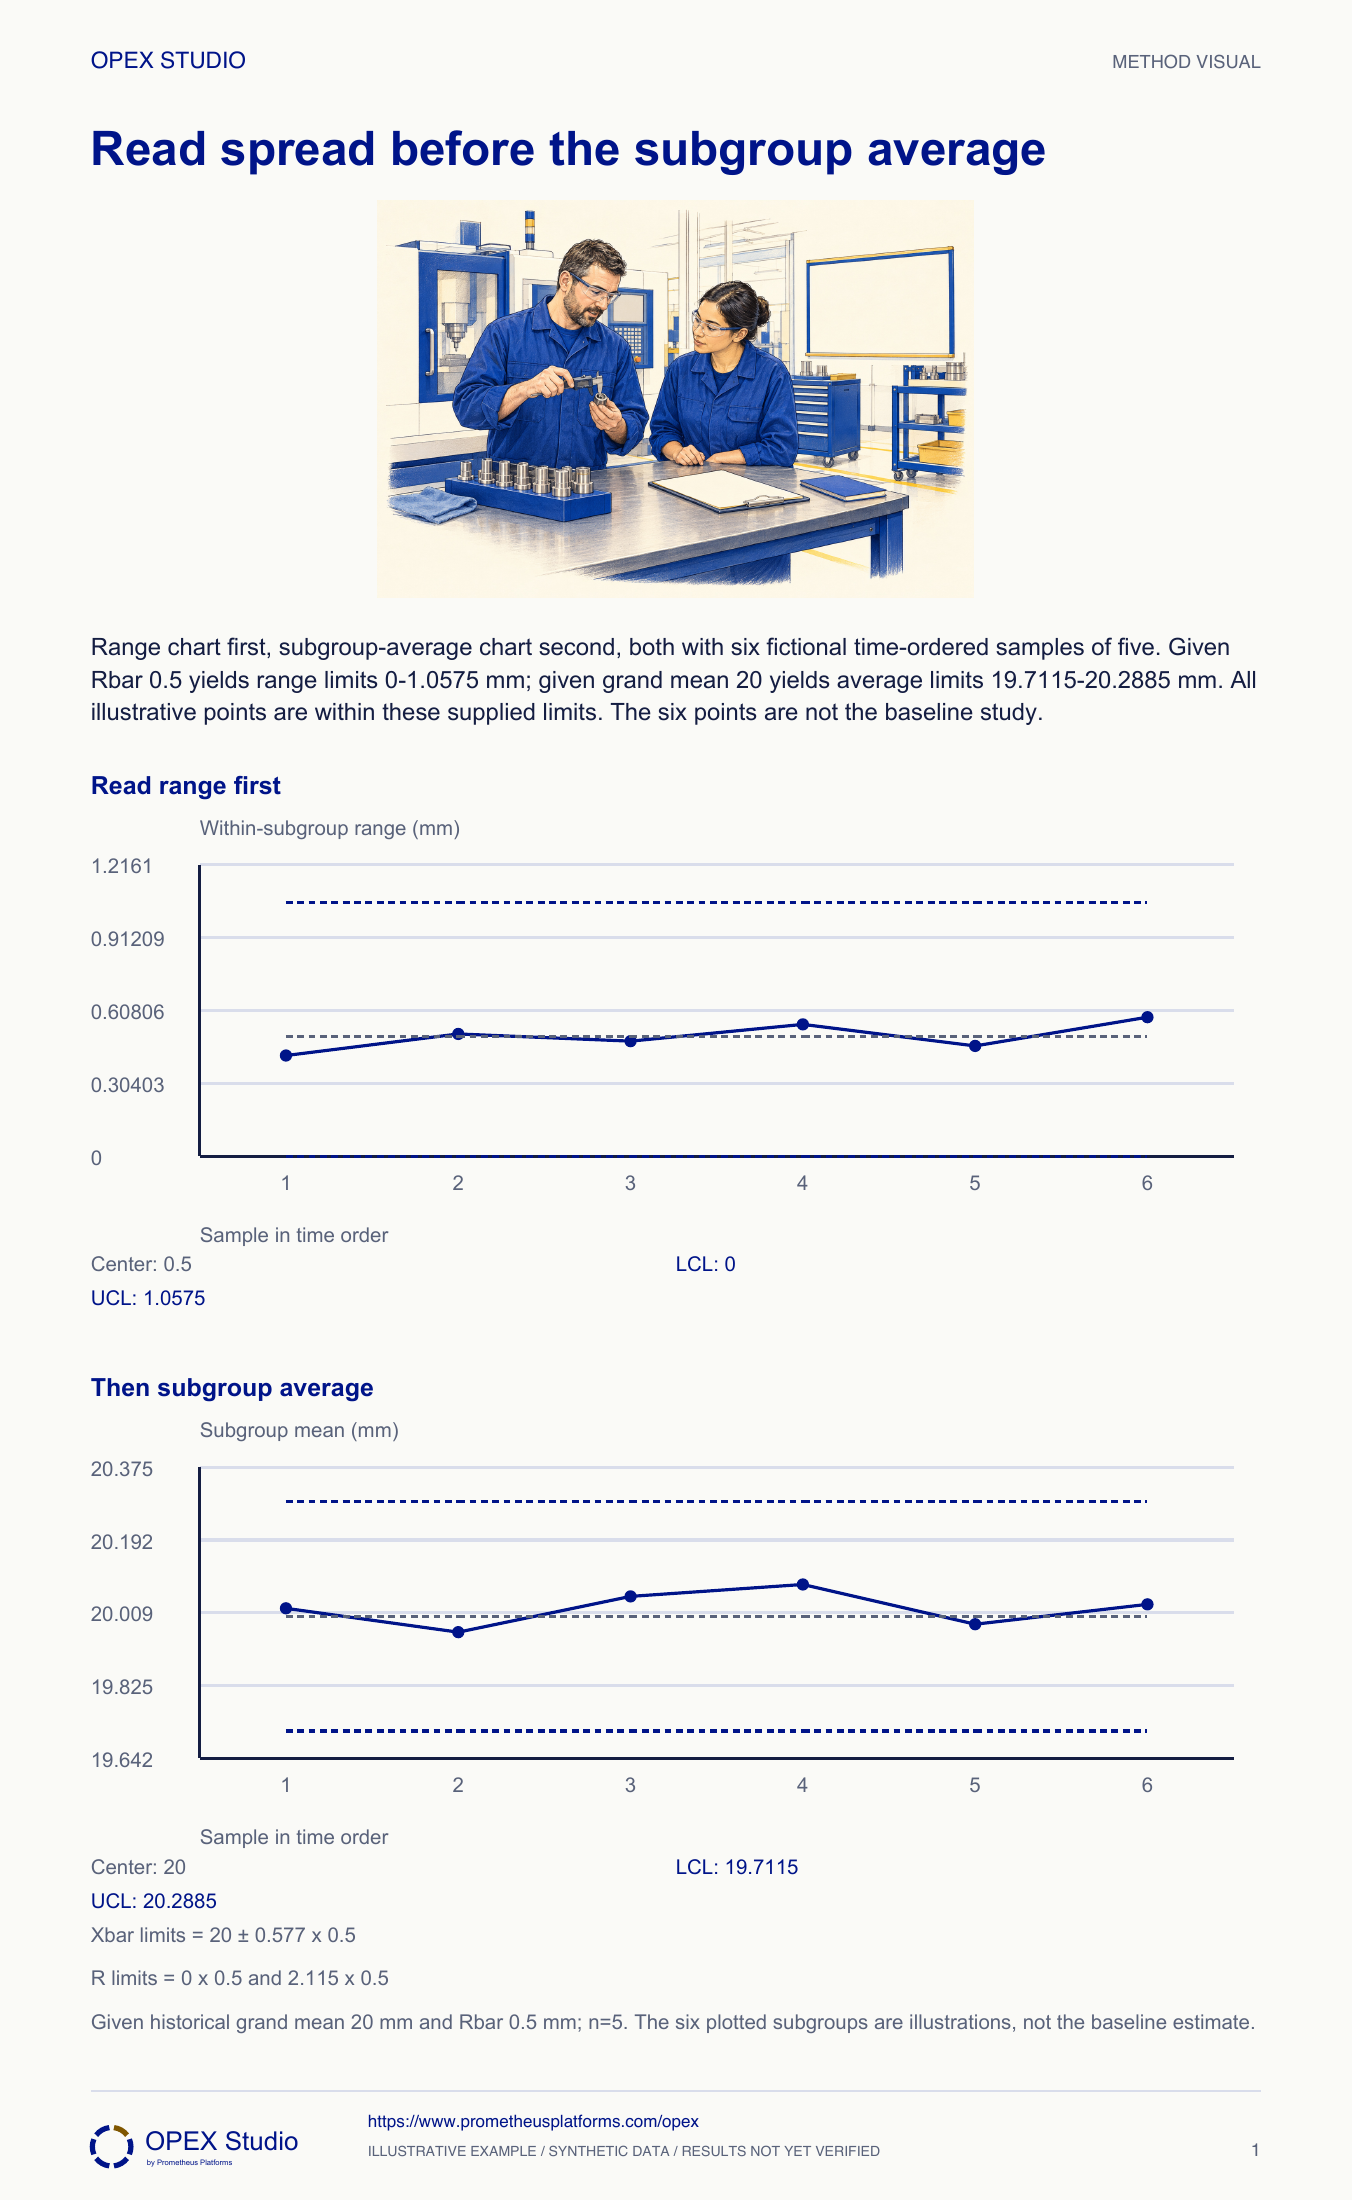
A rational subgroup is intended to expose short-term variation while preserving meaningful changes between samples. For this example each subgroup contains five readings taken under comparable conditions. The range chart helps assess whether that within-subgroup spread is behaving consistently. Review it before interpreting the average chart, whose limits depend on that variation estimate. Constants must match the subgroup size and the chosen method. The displayed points illustrate reading the charts; they do not establish the historical baseline. Do not delete awkward samples merely to obtain attractive limits. Document investigations and use an authorized approach when the underlying process changes.
n=5; supplied grand mean20 and Rbar0.5 mm.
A2=0.577,D3=0,D4=2.115; Xbar limits19.7115–20.2885.
Range limits0–1.0575; read spread before centre.
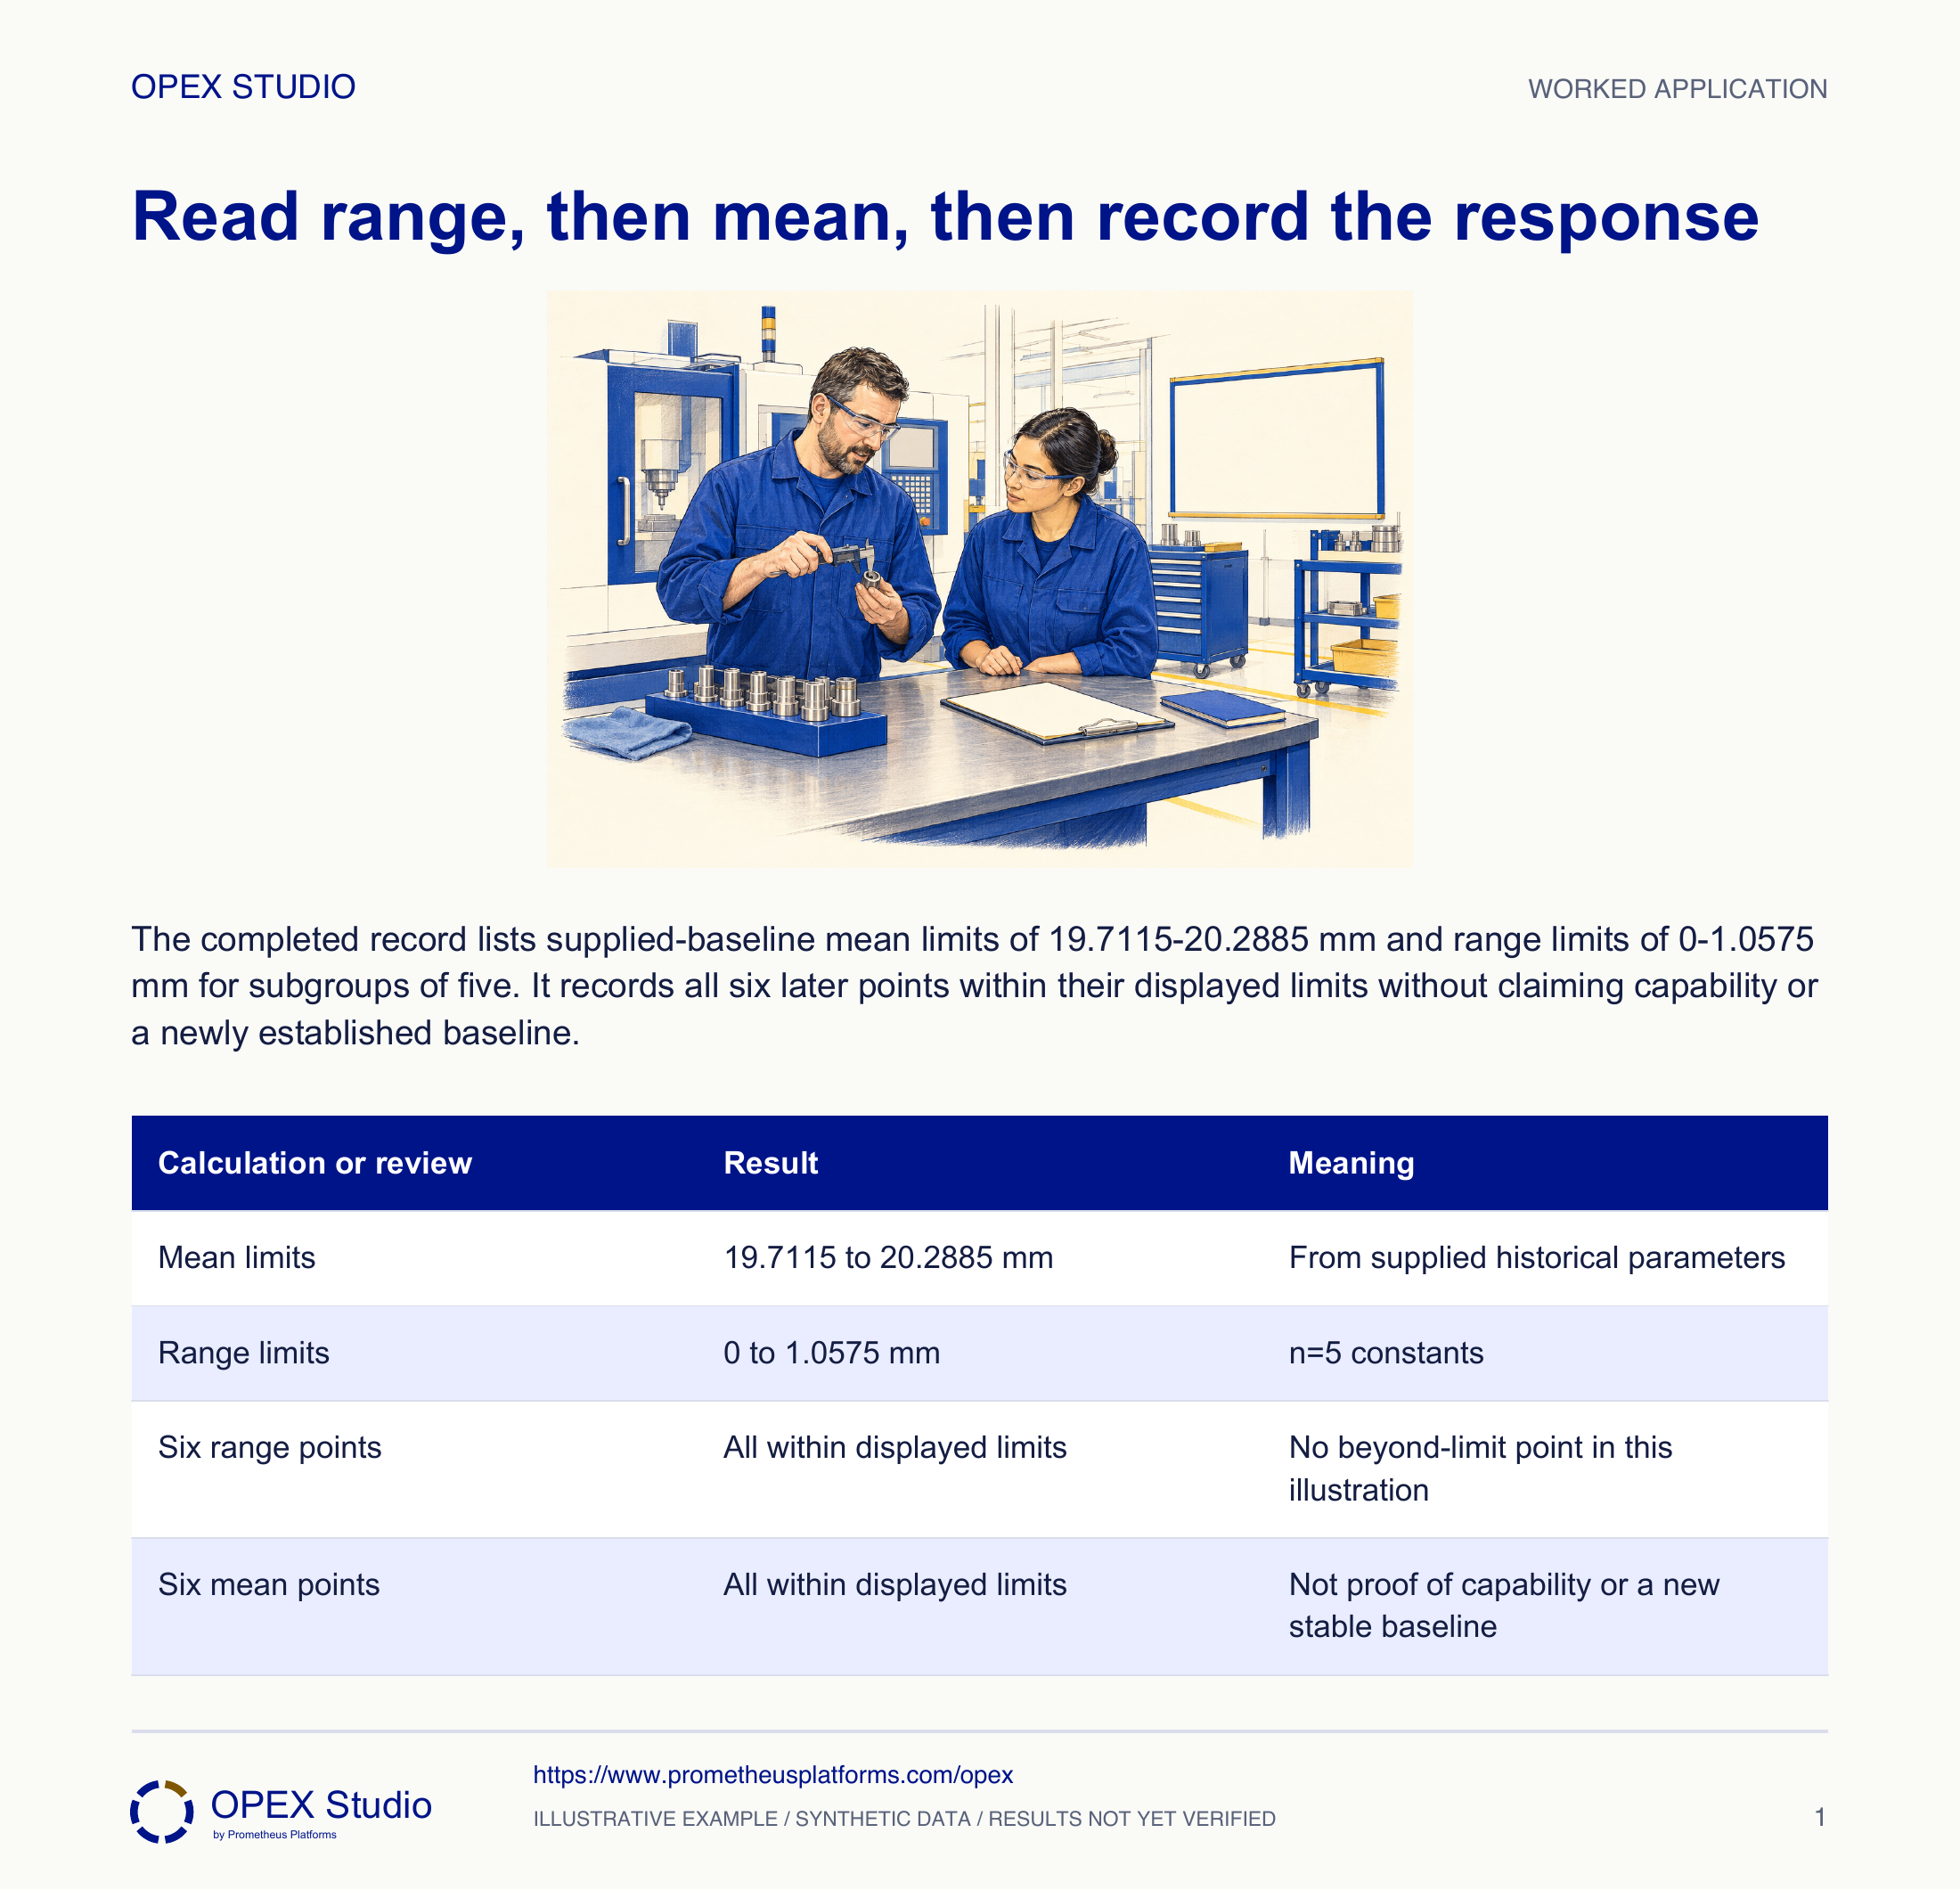
Fictional case: a width process samples five consecutive units per subgroup. A prior reviewed baseline is supplied as grand mean 20.00 mm and average range 0.50 mm. The core charts show six illustrative subgroup means and ranges; those six points are not used to estimate the baseline. Technician Imani checks the calculations and prepares a response record.
Record the range signal because 1.20 exceeds 1.0575; preserve the subgroup data and follow the authorized response before treating the near-center mean as reassuring.
A normal-looking average can hide increased within-group spread. The mean does not cancel the range signal.
Apply supplied subgroup baseline constants, interpret spread before the mean, and record a signal response without confusing limits with specifications.
Fictional case: a width process samples five consecutive units per subgroup. A prior reviewed baseline is supplied as grand mean 20.00 mm and average range 0.50 mm. The core charts show six illustrative subgroup means and ranges; those six points are not used to estimate the baseline. Technician Imani checks the calculations and prepares a response record.
Role: SPC technician with the process owner
Subgroup size is five; measurement and subgroup rationale remain appropriate; historical limits are clearly identified and applied to later observations.
The draft report recomputes limits from the six demonstration points and reads the mean chart first. That changes the stated evidence and can hide a spread problem.
| Input | Supplied value |
|---|---|
| Subgroup size | n=5 |
| Historical grand mean / average range | 20.00 mm /0.50 mm |
| Constants for n=5 | A2=.577; D3=0; D4=2.115 |
| Illustrative ranges | 0.42,0.51,0.48,0.55,0.46,0.58 mm |
| Illustrative means | 20.02,19.96,20.05,20.08,19.98,20.03 mm |
Imani verifies that each point summarizes five consecutive units under the stated collection design and that units are millimetres. She keeps subgroup identity and raw readings available.
Why: Five values collected across unrelated conditions are not automatically a useful subgroup. The collection design is part of the interpretation, not a chart-format preference.
Evidence: n=5 and the source of each subgroup are explicit.
She uses 20 ± .577×.50 for mean limits 19.7115 and 20.2885 mm. Range limits are 0×.50=0 and 2.115×.50=1.0575 mm.
Why: The constants correspond to subgroup size five. Replacing the historical averages with the six plotted examples would silently answer a different question.
Evidence: Calculation record identifies the historical baseline and constants.
She compares each displayed range with 0 and 1.0575 mm. The six supplied ranges show no point beyond these limits under the stated point rule.
Why: The mean-chart interpretation depends on a suitable within-subgroup spread estimate. An abnormal spread should not be ignored because the means look quiet.
Evidence: The record describes the observed range comparison without claiming a new baseline study.
The six displayed means lie between 19.7115 and 20.2885 mm. Imani records the rule examined and avoids claiming that six points establish control or capability.
Why: Absence of an observed signal is weaker than proof of future stability. A mean within control limits also says nothing by itself about individual product conformance.
Evidence: No beyond-limit mean point in the illustrative sequence; product limits not supplied.
She prepares a record for subgroup identity, raw values, measurement checks, relevant changes and authorized containment/investigation. Limits stay frozen unless a justified baseline review approves a change.
Why: Widening a limit to absorb a signal would conceal the condition. Investigation must preserve the original signal and distinguish correction from learning about its cause.
Evidence: The reaction record names the process and quality owners and the next verification.
| Calculation or review | Result | Meaning |
|---|---|---|
| Mean limits | 19.7115 to 20.2885 mm | From supplied historical parameters |
| Range limits | 0 to 1.0575 mm | n=5 constants |
| Six range points | All within displayed limits | No beyond-limit point in this illustration |
| Six mean points | All within displayed limits | Not proof of capability or a new stable baseline |
A later fictional subgroup has mean 20.02 mm and range 1.20 mm.
Record the range signal because 1.20 exceeds 1.0575; preserve the subgroup data and follow the authorized response before treating the near-center mean as reassuring.
A normal-looking average can hide increased within-group spread. The mean does not cancel the range signal.
The signal record includes the 1.20 mm range and original historical limit.
New fictional process uses n=5, historical grand mean 30.00 mm and Rbar 0.40 mm. A later subgroup has mean 30.30 mm and range 0.70 mm. Use the same n=5 constants.
| Given | Value |
|---|---|
| Grand mean | 30.00 mm |
| Rbar | 0.40 mm |
| Later mean / range | 30.30 mm /0.70 mm |
Mean limits are 30 ± .577×.40=29.7692 and 30.2308 mm. Range limits are 0 and 2.115×.40=.846 mm.
Range .70 is within the displayed range limits; mean 30.30 exceeds 30.2308 and signals under the stated point rule. Product release still requires the actual specification and applicable decision process.
| Chart | Limits | Later point |
|---|---|---|
| R | 0 to .846 mm | .70: within |
| Xbar | 29.7692 to 30.2308 mm | 30.30: above UCL |
Which numbers are supplied rather than estimated here?
What can a near-center average hide?
Which point signals and under what rule?
What would be wrong with widening the limit?
Work both charts on paper and write the reaction before revealing the answer.
Owner: SPC owner with station quality lead
Record: Baseline revision, subgroup record and signal investigation
Review: At each defined subgroup and after reviewed process changes
Evidence: Traceable data and verified response with unchanged justified limits
Investigate measurement/process conditions; revise the baseline only through the authorized evidence review.
Mean and dispersion charts answer different questions; subgroup size determines constants. Range charts suit relatively small subgroups.
Public primary-source summary; underlying paid standards/forms are not reproduced.Read the lessons online or use these PDFs to prepare, practise and review with your team. No sign-in needed.
Case objectives, demonstration plans, debriefs, common mistakes and application checks across all 81 workplace cases and method lessons.
Download Facilitator guide PDF · 166 pages · 65.1 MBPrintable case worksheets, blank observation records and five calculation exercises; answers are separate.
Download Learner workbook PDF · 169 pages · 10.7 MBReasoned sample responses, worked calculations and coaching guidance; fictional examples are clearly labelled.
Download Answer key and coaching notes PDF · 105 pages · 8.5 MBThe native method mechanisms and worked applications for all 68 detailed lessons, in a separate bookmarked portrait reference.
Download Method and application reference PDF · 141 pages · 10.2 MBFive illustrated system chapters: 15 Flare concept maps and 26 original workplace teaching cards, with links to all 81 supporting cases and method lessons.
Download Illustrated systems atlas PDF · 69 pages · 55.8 MBExplore this connected method and its separate application conditions.
Explore the connected method →Explore this connected method and its separate application conditions.
Explore the connected method →Explore this connected method and its separate application conditions.
Explore the connected method →