Facilitator guide
Case objectives, demonstration plans, debriefs, common mistakes and application checks across all 81 workplace cases and method lessons.
Download Facilitator guide PDF · 166 pages · 65.1 MB OPEXSTUDIO
Identify setpoint, measured variable and sign convention.. Follow the visual, practise a decision, then check your thinking.
Fictional teaching examples and AI-generated illustrations. Proposed changes and goals are not achieved results. Use the written instructions and check local conditions before applying a method.
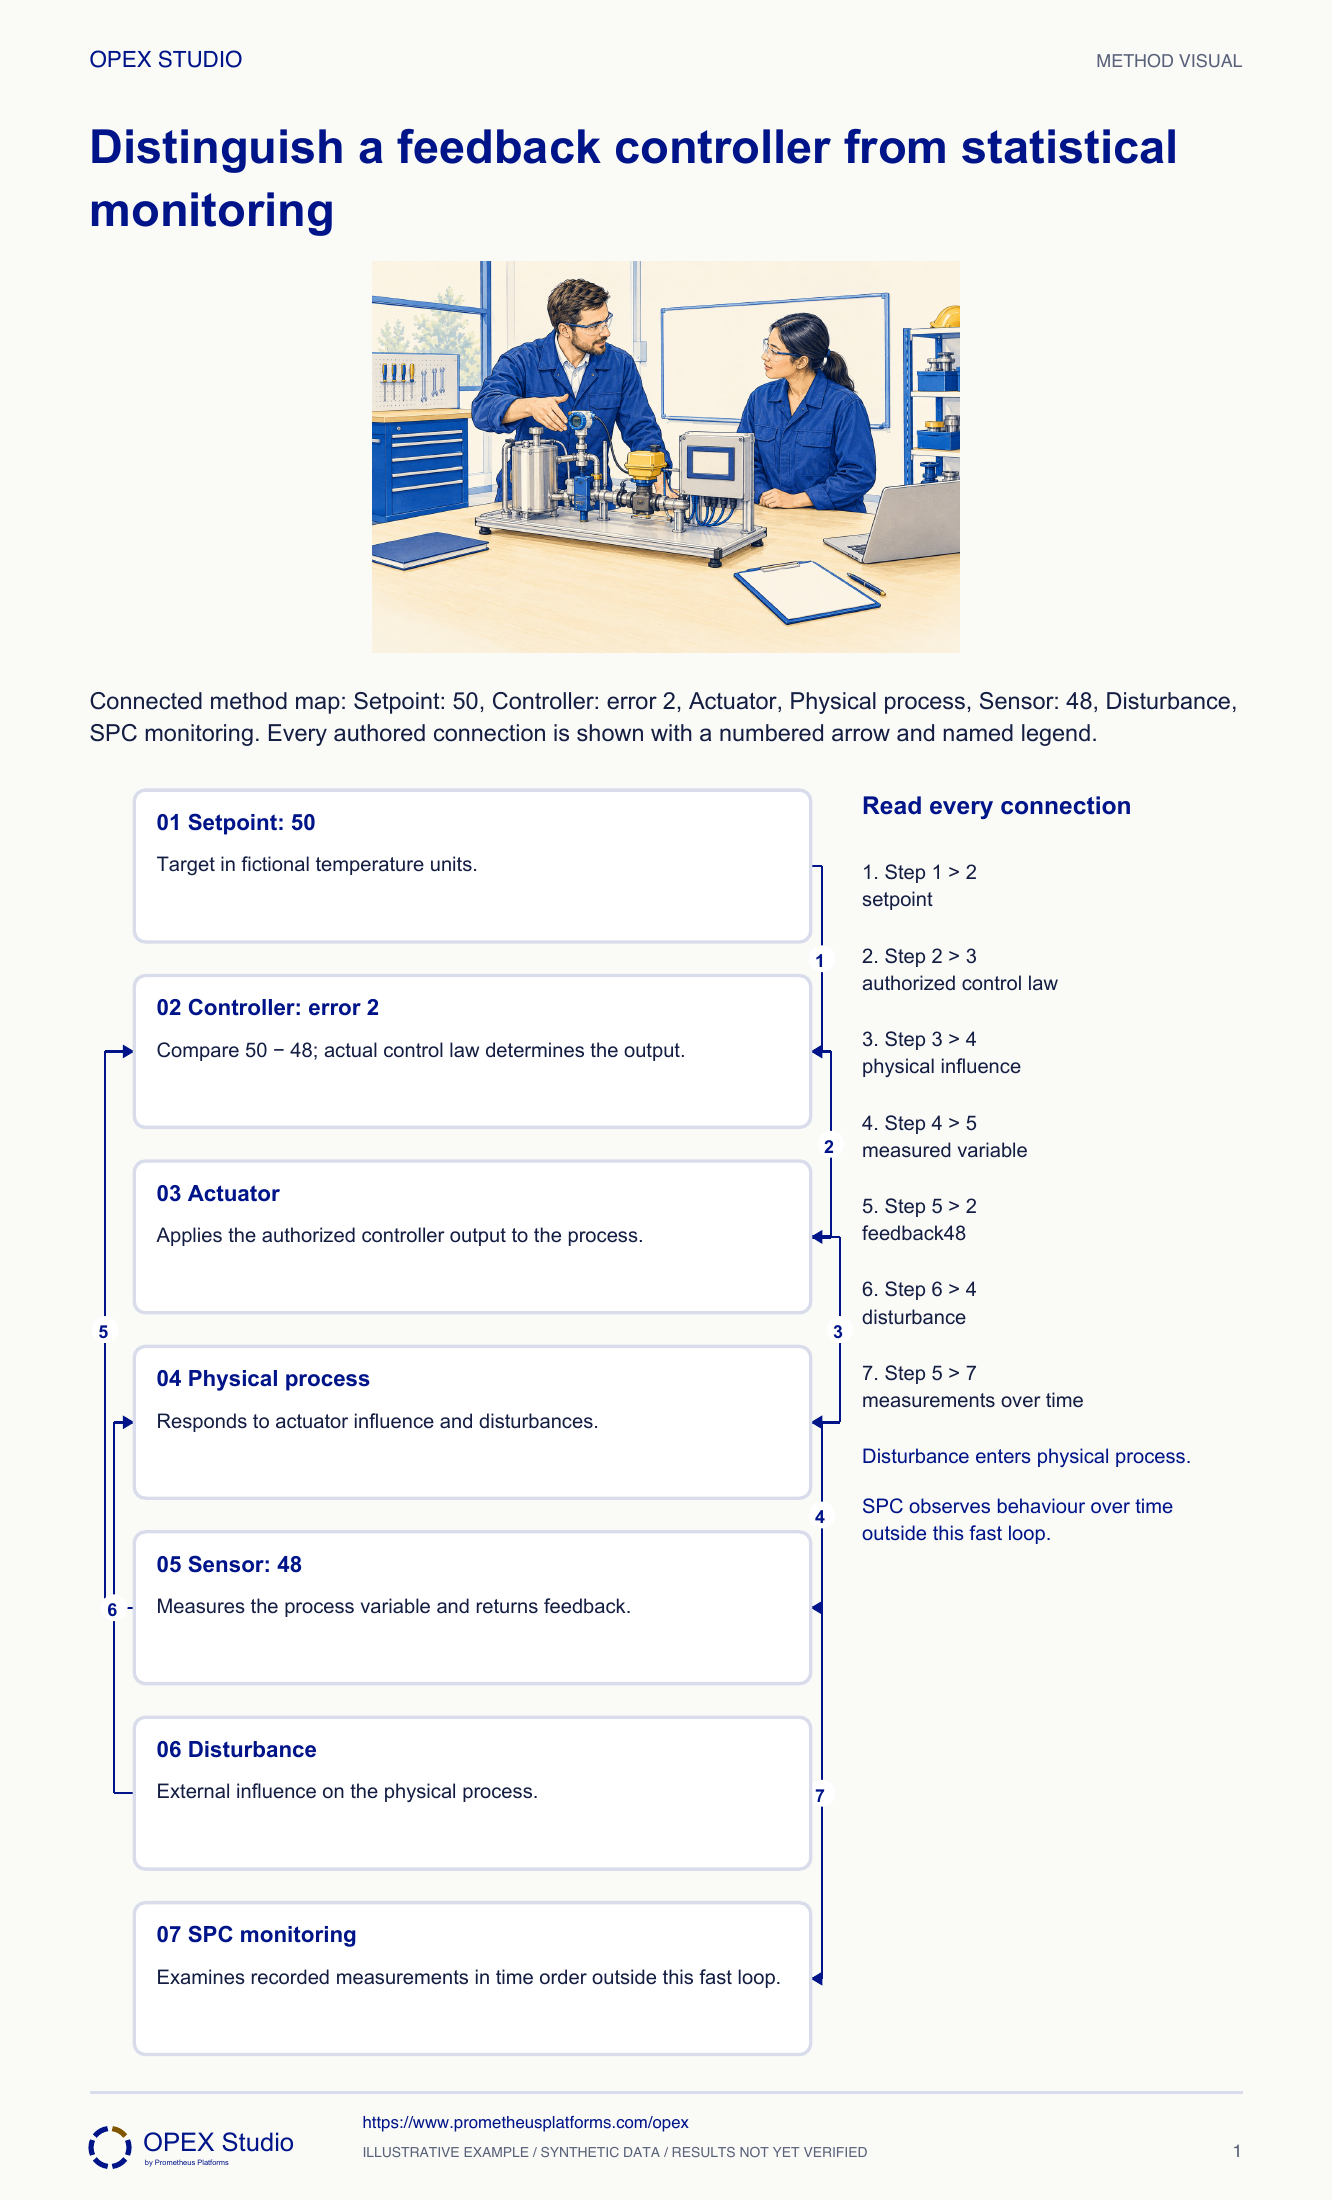
An engineering feedback loop measures a variable, compares it with a setpoint and uses a controller and actuator to influence the physical process. The sensor returns information so the loop can respond to disturbances. With the stated sign convention, error is setpoint minus measurement. That arithmetic does not specify the controller output: a real control law, dynamics and safety design determine the action. Statistical process monitoring asks a different question about patterns over time and sits outside this simplified fast loop. Do not interpret a control-chart signal as a recipe for tuning gains or bypassing equipment protections. This diagram explains roles, not a safe implementation for a particular machine.
Error=setpoint−measurement=50−48=2 fictional temperature units.
Error is not an actuator command or PID gain.
SPC monitoring and engineering feedback operate as different functions.
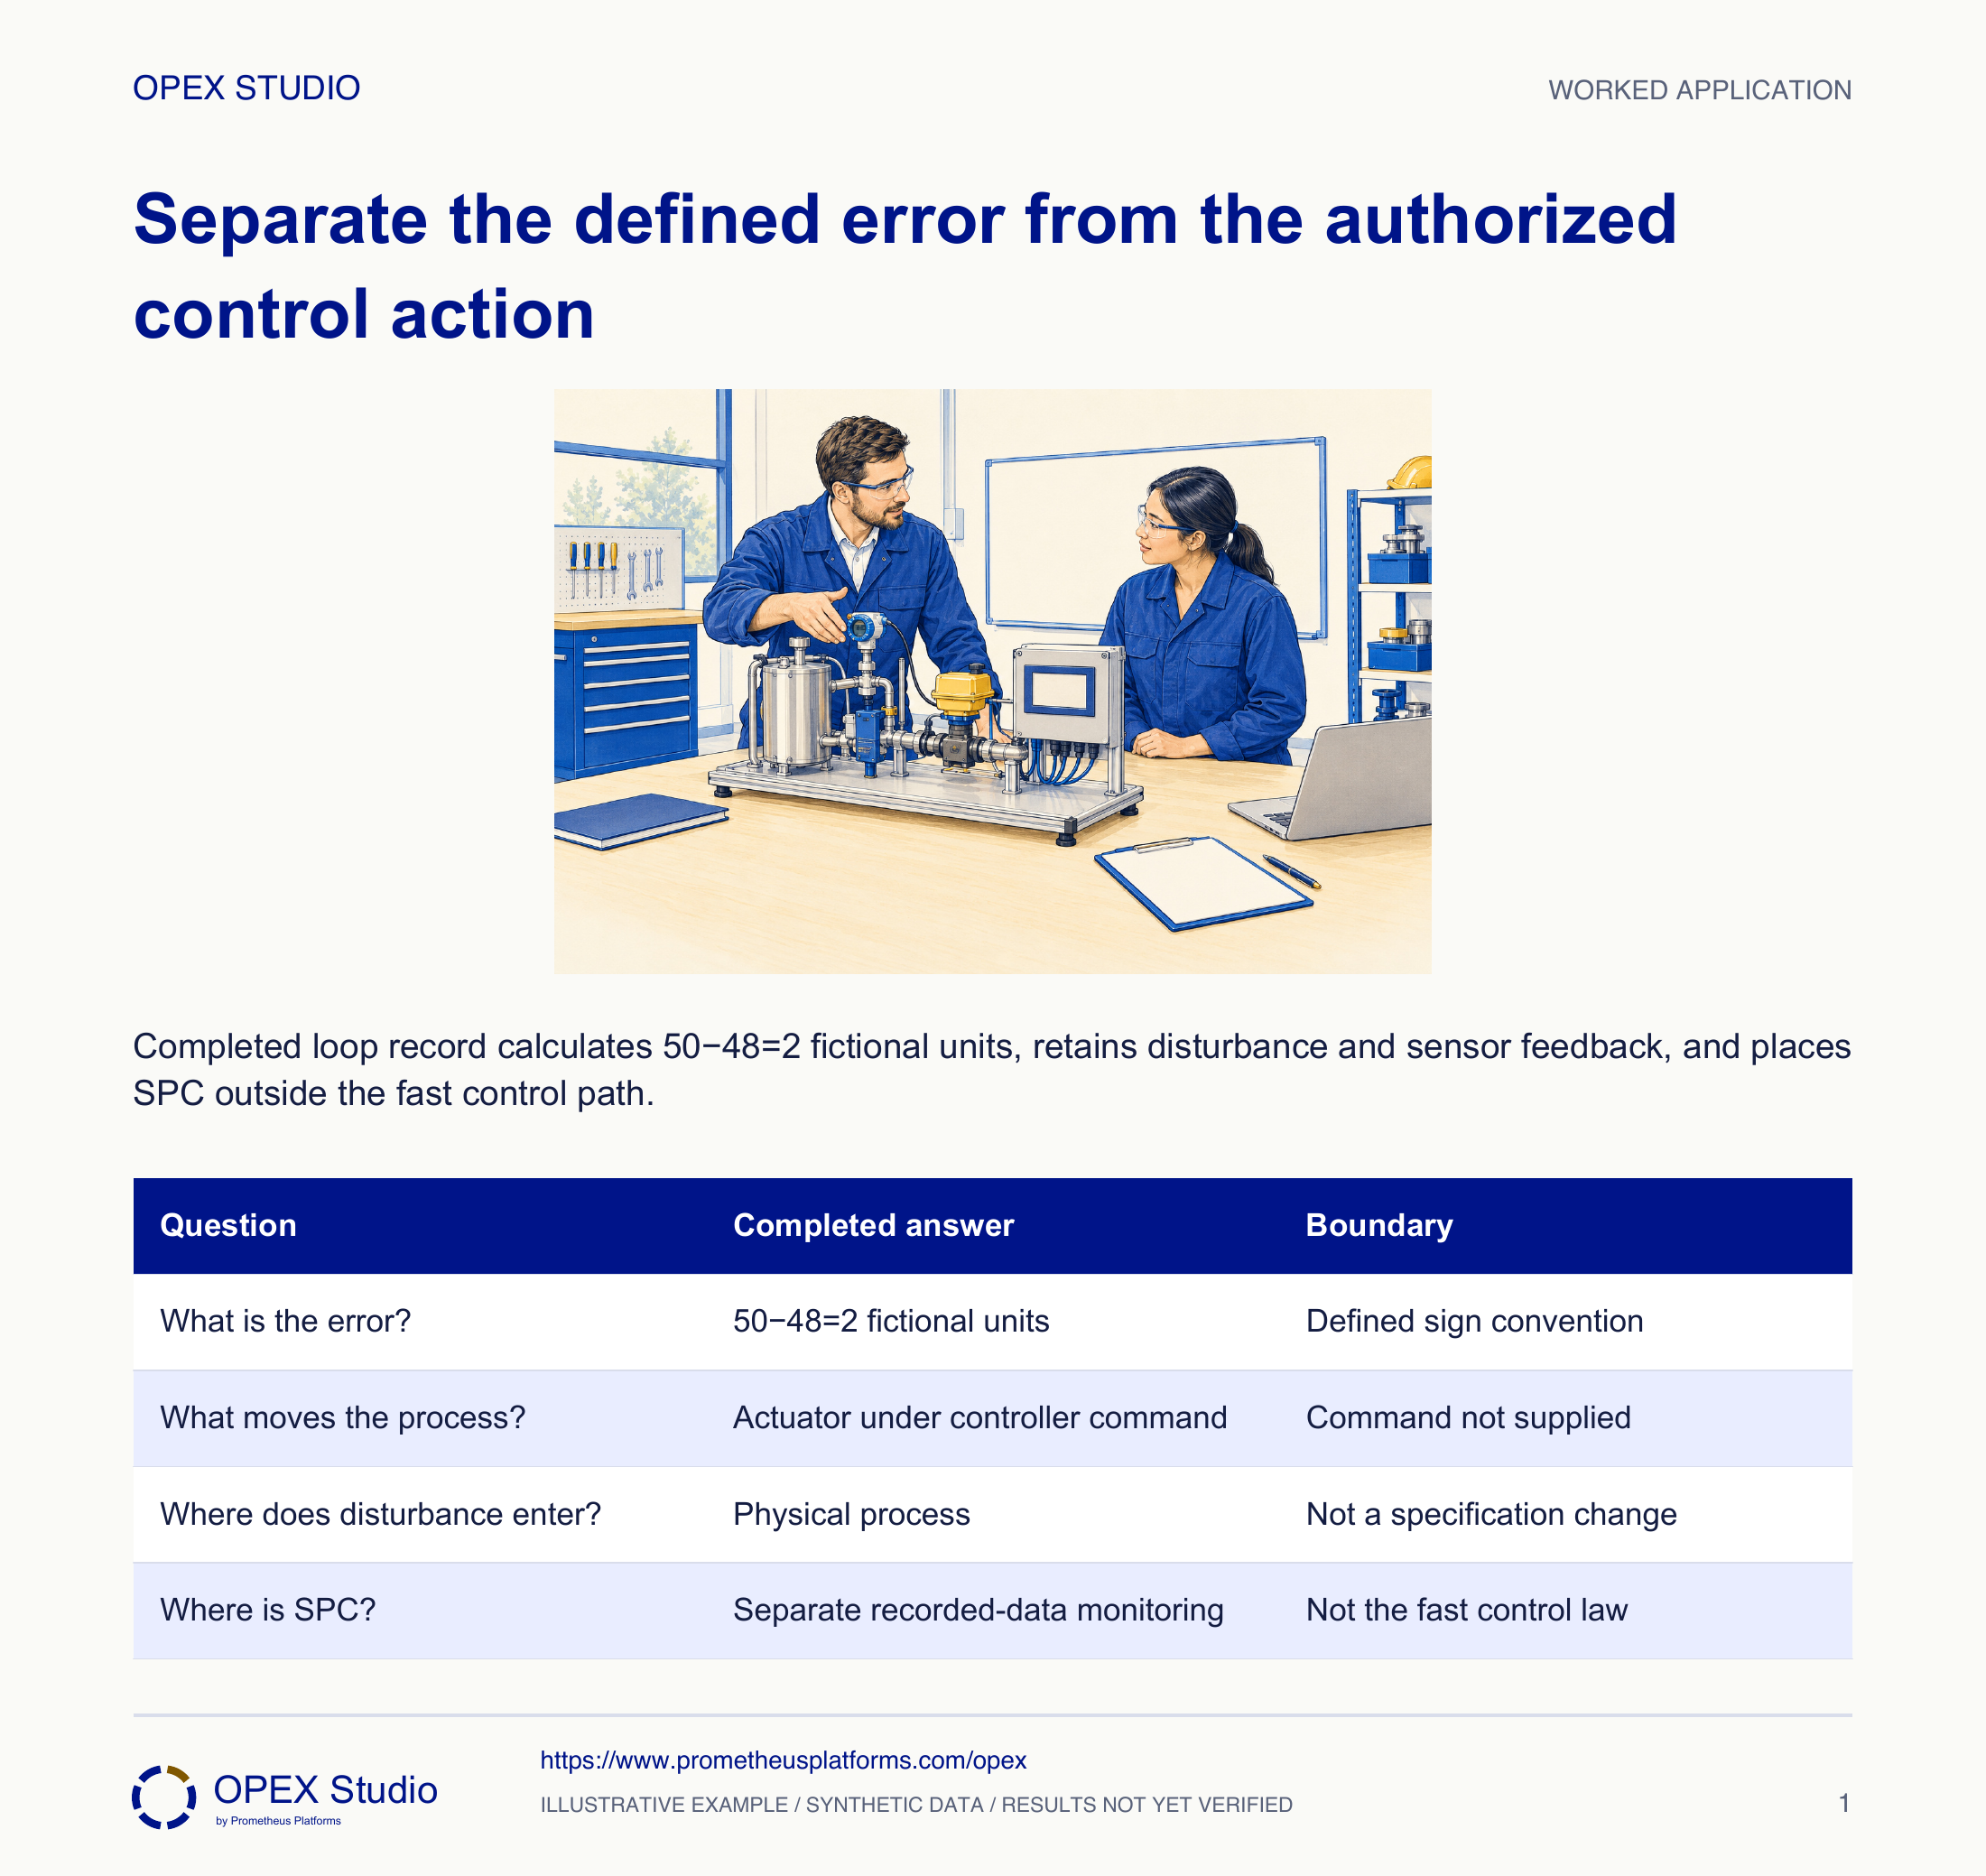
Fictional case: a teaching controller has setpoint 50 and measured value 48 in fictional temperature units. The defined error is setpoint minus measurement, so it is 2. The core loop retains these exact values and the separate disturbance and SPC-monitoring paths. Technician Kai must explain the diagram without prescribing a valve position or PID gain.
Escalate through the applicable instrumentation/process procedure and distinguish measurement validity from a real process deviation. Do not tune the controller to compensate for an unverified sensor problem.
The loop acts on feedback; bad measurement can mislead both controller and monitoring. Repair authority and safe state depend on the actual system.
Identify the elements of a physical feedback loop, calculate a defined error and distinguish controller action from statistical monitoring.
Fictional case: a teaching controller has setpoint 50 and measured value 48 in fictional temperature units. The defined error is setpoint minus measurement, so it is 2. The core loop retains these exact values and the separate disturbance and SPC-monitoring paths. Technician Kai must explain the diagram without prescribing a valve position or PID gain.
Role: Controls engineer and process learner
A specified controller compares measured feedback with a reference and applies its authorized control law through an actuator; measurement and disturbances are represented accurately.
A learner says “error 2 means open the valve 2%” and moves the SPC chart into the fast control loop.
| Loop element | Supplied role/value |
|---|---|
| Setpoint | 50 fictional units |
| Sensor reading | 48 fictional units |
| Error definition | Setpoint minus measured value |
| Controller output | Not calculable without the authorized control law |
| Disturbance | Acts on the physical process |
| SPC | Observes recorded measurements over time separately |
Kai follows setpoint to controller, controller output to actuator, actuator influence to process, and measured feedback from sensor to controller. He identifies the disturbance entering the process.
Why: A loop diagram should distinguish information from physical influence. A missing feedback edge changes the mechanism, not merely the picture.
Evidence: Every core edge is accounted for, including sensor return and disturbance entry.
Using the stated convention, Kai computes 50−48=2 fictional units. He writes the convention because an alternate sign definition would change the numerical sign.
Why: The error has the units of the compared variable. It is not automatically an actuator percentage or an instruction to adjust equipment.
Evidence: The record contains setpoint, measurement, sign convention and error units.
He explains that the actual controller law, configuration, dynamics and limits determine the command. The exercise supplies none, so no valve opening or gain can be derived.
Why: A proportional-looking arithmetic shortcut would invent a control law and ignore physical constraints. The correct teaching response is to identify what is missing.
Evidence: Controller output is explicitly not determined from the supplied values.
The recorded sensor values can also feed a time-order statistical monitoring view outside the fast feedback path. That view can reveal longer-term behavior and prompt investigation through the process response.
Why: Statistical monitoring and engineering feedback serve different functions. A control-chart limit is not a controller setpoint, and a chart signal is not itself a tuning command.
Evidence: The diagram preserves a separate measurement-to-SPC branch.
Kai proposes using a simulation or approved training system to show how a disturbance changes measurement and how an authorized controller responds. Real settings remain under qualified engineering control.
Why: Understanding the mechanism can be taught without providing unvalidated operating instructions. The lesson should develop reasoning about paths and authority.
Evidence: The next exercise labels simulated behavior and does not modify actual equipment.
| Question | Completed answer | Boundary |
|---|---|---|
| What is the error? | 50−48=2 fictional units | Defined sign convention |
| What moves the process? | Actuator under controller command | Command not supplied |
| Where does disturbance enter? | Physical process | Not a specification change |
| Where is SPC? | Separate recorded-data monitoring | Not the fast control law |
The sensor reports 48, but an approved independent check indicates a measurement fault.
Escalate through the applicable instrumentation/process procedure and distinguish measurement validity from a real process deviation. Do not tune the controller to compensate for an unverified sensor problem.
The loop acts on feedback; bad measurement can mislead both controller and monitoring. Repair authority and safe state depend on the actual system.
The evidence record marks sensor validity unresolved and names the qualified owner.
New fictional simulation has setpoint 60, reading 63 and the same error convention. A learner proposes an actuator command of−3 and says a control-chart signal confirms that command.
| Input | Value |
|---|---|
| Setpoint | 60 |
| Measured value | 63 |
| Error convention | Setpoint minus measurement |
| Control law | Not supplied |
Error=60−63=−3 fictional units. That is a comparison result, not an actuator command; the authorized control law and system constraints are not supplied.
Sensor feedback returns to the controller; controller output drives the actuator and process. A disturbance acts on the process. SPC examines measurements over time separately and does not validate an invented command.
| Item | Result | Meaning |
|---|---|---|
| Error | −3 fictional units | Measurement above reference under this convention |
| Actuator output | Undetermined | Need authorized control law |
| SPC signal | Monitoring evidence | Not a tuning instruction |
Which arrows carry information and which influence the process?
What units does the result have?
What remains unknown despite correct arithmetic?
Why might adjustment worsen the problem?
Draw both paths first, then annotate only values actually supplied.
Owner: Qualified controls engineer with process owner
Record: Controlled loop design, instrument status and monitoring-response records
Review: At approved changes and relevant abnormality reviews
Evidence: Valid measurement and verified behavior under authorized design
Investigate sensor/process/controller evidence through the qualified authority; never infer tuning from a teaching diagram.
A control loop relates sensor measurements, controller/setpoint logic and actuator commands with process feedback.
Public primary-source summary; underlying paid standards/forms are not reproduced.Read the lessons online or use these PDFs to prepare, practise and review with your team. No sign-in needed.
Case objectives, demonstration plans, debriefs, common mistakes and application checks across all 81 workplace cases and method lessons.
Download Facilitator guide PDF · 166 pages · 65.1 MBPrintable case worksheets, blank observation records and five calculation exercises; answers are separate.
Download Learner workbook PDF · 169 pages · 10.7 MBReasoned sample responses, worked calculations and coaching guidance; fictional examples are clearly labelled.
Download Answer key and coaching notes PDF · 105 pages · 8.5 MBThe native method mechanisms and worked applications for all 68 detailed lessons, in a separate bookmarked portrait reference.
Download Method and application reference PDF · 141 pages · 10.2 MBFive illustrated system chapters: 15 Flare concept maps and 26 original workplace teaching cards, with links to all 81 supporting cases and method lessons.
Download Illustrated systems atlas PDF · 69 pages · 55.8 MBExplore this connected method and its separate application conditions.
Explore the connected method →Explore this connected method and its separate application conditions.
Explore the connected method →Explore this connected method and its separate application conditions.
Explore the connected method →